
Full text
Introduction
Hypertension remains the leading modifiable factor of cardiovascular morbidity and mortality; the number of people with elevated blood pressure (BP) worldwide has doubled over three decades, while BP control is achieved in fewer than one quarter of patients [1, 2]. Persons held in penitentiary institutions form a distinct population in which the prevalence of cardiovascular disease, diabetes mellitus and metabolic disorders exceeds population estimates, whereas access to preventive interventions is restricted by the conditions of confinement [3–5]. Chronic stress, social deprivation and limited autonomy with regard to diet and physical activity create the preconditions for the consolidation of unfavorable mechanisms of vascular tone regulation [6, 7].
Psychoemotional strain is regarded as an independent factor in the development and progression of hypertension [8, 9]; however, its quantitative contribution to the probability of an uncontrolled course of hypertension in penitentiary institutions, as well as the role of the length of isolation in the accumulation of combined cardiometabolic pathology, has been insufficiently studied. For the medical unit of an institution, what matters is not declarative prevention but a reproducible system of risk ranking from which a monitoring schedule directly follows.
The aim of the study was to identify the clinical and prognostic determinants of unfavorable phenotypes of hypertension in persons held in penitentiary institutions, taking into account sex and the length of imprisonment, and to substantiate a model for stratifying the risk of uncontrolled hypertension.
Materials and Methods
The study was carried out at Specialized Hospital No. 23 for convicts of the First Regional Territorial Directorate of the Department for the Execution of Punishments under the Ministry of Internal Affairs of the Republic of Uzbekistan. The analysis included 153 patients with verified hypertension aged 45–59 years (mean age 50.81±0.41 years; median 48.0 [47.0; 55.0] years). Taking sex and the length of stay in the closed environment into account, three groups were formed: group 1 — women (n=20; term of imprisonment 1–7 years, mean 3.4±2.1 years), group 2 — men with a term of 1–5 years (n=61; 2.8±1.4 years), group 3 — men with a term of 5–20 years (n=72; 11.4±3.2 years). Comparison of group 1 with the male groups reflected the sex component, and comparison of groups 2 and 3 the effect of the length of isolation; the 95% CIs of the mean term in the male groups did not overlap (2.45–3.15 vs 10.66–12.14 years).
The clinical stage included analysis of medical records, verification of the grade of hypertension and the stage of hypertensive disease (HD), associated conditions (coronary heart disease (CHD), angina, chronic heart failure (CHF), type 2 diabetes mellitus (T2DM)) and anthropometry with calculation of body mass index (BMI). BP was measured with an Omron HEM-907 automatic monitor after 5–10 min of rest at least twice at 1–2-min intervals; the grade of hypertension was defined according to current guidelines [2, 10]. Electrocardiography was recorded on a 12-lead Schiller AT-10 PLUS device (PQ interval, QRS complex, ST segment, T and R waves), and echocardiography on a Mindray DC-70 system (end-diastolic and end-systolic dimensions and volumes, interventricular septal thickness (IVST), stroke volume, ejection fraction (EF), left ventricular mass (LVM) and its index (LVMI)); LV hypertrophy (LVH) was diagnosed at LVMI >95 g/m2 in women and >115 g/m2 in men [11]. 24-h ECG monitoring was performed with a Schiller BR-102 PLUS system. Biochemical parameters (glucose, creatinine, urea, total cholesterol, LDL-C, HDL-C, triglycerides) were determined on a Mindray BS-240 analyzer; fibrinogen, platelets, APTT, INR and D-dimer were also assessed.
Psychoemotional status was evaluated with the Beck Depression Inventory, the Hamilton scale, the WAM (well-being, activity, mood) test and the Buss–Durkee inventory; functional independence was assessed with the Barthel Index [12–15]. Integral stress and depression scores (Stress score, Depression score) were used in prognostic modeling; they were available for 150 patients. Uncontrolled grade 2 hypertension was defined as SBP ≥160 and/or DBP ≥100 mm Hg.
Statistical processing was performed in Microsoft Excel 2019. Data are presented as M±m, M±SD or Me [Q1; Q3]. ANOVA and the Kruskal–Wallis test, Pearson's χ² test and Fisher's exact test with calculation of Cramér's V and odds ratios (OR) with 95% CI, Pearson and Spearman correlation analysis, and linear and logistic regression with assessment of discriminative ability by AUC and selection of the threshold by the Youden index were used. The critical significance level was p<0.05.
Results
The groups were identical in age (50.90±1.16; 50.82±0.65; 50.78±0.60 years; p=0.996) and in the distribution of age intervals (Cramér's V=0.006). Grade 2 hypertension was present in 78.4% of the subjects and stage III HD in 64.1% without intergroup differences (63.9–65.0%; p=0.999). Grade 2 hypertension was recorded more often in men than in women (81.2% vs 60.0%; p=0.038; OR 3.00; 95% CI 1.11–8.14), and this association persisted after adjustment for age (OR 3.49; 95% CI 1.18–10.34; p=0.024); the male groups did not differ in the grade of hypertension (p=0.656). CHD was noted in 64.1%, angina in 54.9% and CHF in 9.2%, with virtually identical frequencies across the groups (p>0.94). The proportion of T2DM increased from 10.0% in women to 13.1% in men with a term of 1–5 years and 22.2% in men with a term of 5–20 years (p=0.254). Structural differences emerged at the level of multimorbidity (Figure 1).
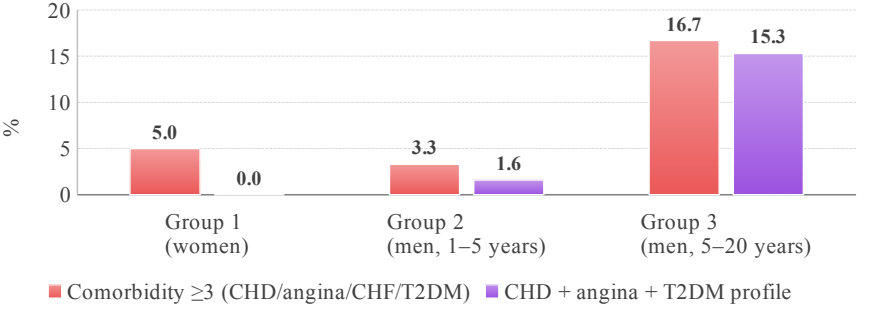
Three or more comorbid conditions were present in 16.7% of men in group 3 versus 3.3% in group 2 (p=0.020; OR 5.90; 95% CI 1.27–27.51); in a logistic model adjusted for age and the metabolic cluster, a long term retained an independent association with comorbidity ≥3 (OR 6.00; 95% CI 1.28–28.08; p=0.023; AUC 0.710), whereas age (OR 1.02; p=0.709) and the metabolic cluster (OR 0.52; p=0.386) made no significant contribution. The combination of CHD + angina + T2DM was recorded in 15.3% of men in group 3 versus 1.6% in group 2 and did not occur in women (OR 10.82; 95% CI 1.35–86.42; p=0.006).
The clinical-instrumental profile of target-organ damage was homogeneous across the groups (Table 1).
| Parameter | Group 1 (n=20) | Group 2 (n=61) | Group 3 (n=72) | p |
|---|---|---|---|---|
| IVST, mm (M±m) | 14.20±0.72 | 14.08±0.42 | 14.12±0.37 | 0.989 |
| EF, % (M±m) | 49.27±0.81 | 49.35±0.46 | 49.32±0.42 | 0.996 |
| LVMI, g/m2 (M±m) | 132.45±3.17 | 132.66±1.78 | 133.79±1.58 | 0.866 |
| QRS, s (M±m) | 0.166±0.013 | 0.165±0.007 | 0.169±0.007 | 0.912 |
| D-dimer, ng/mL (M±m) | 660.0±8.9 | 660.7±5.0 | 662.5±4.5 | 0.948 |
| LVH by LVMI, n (%) | 20 (100.0) | 55 (90.2) | 66 (91.7) | 0.357 |
| EF <50%, n (%) | 13 (65.0) | 39 (63.9) | 45 (62.5) | 0.973 |
| QRS >0.12 s, n (%) | 12 (60.0) | 36 (59.0) | 45 (62.5) | 0.917 |
A mean IVST of about 14 mm, LVMI above 130 g/m2 and EF of about 49% indicated an almost universal hypertrophic pattern with borderline pump function. Within-sample relationships proved more informative than intergroup comparisons: IVST correlated inversely with EF (ρ=−0.506; p<0.001), LVMI directly with QRS duration (ρ=0.166; p=0.040), and D-dimer showed a strong association with LVMI (ρ=0.542; p<0.001) and negative associations with fibrinogen (ρ=−0.310) and platelets (ρ=−0.362). In linear regression, each 1-mm increase in IVST was accompanied by a 0.592 percentage-point decrease in EF (95% CI −0.745 to −0.438; R2=0.280), and each 1-ng/mL increase in D-dimer by a 0.219 g/m2 increase in LVMI (R2=0.383), with no independent contribution of group membership.
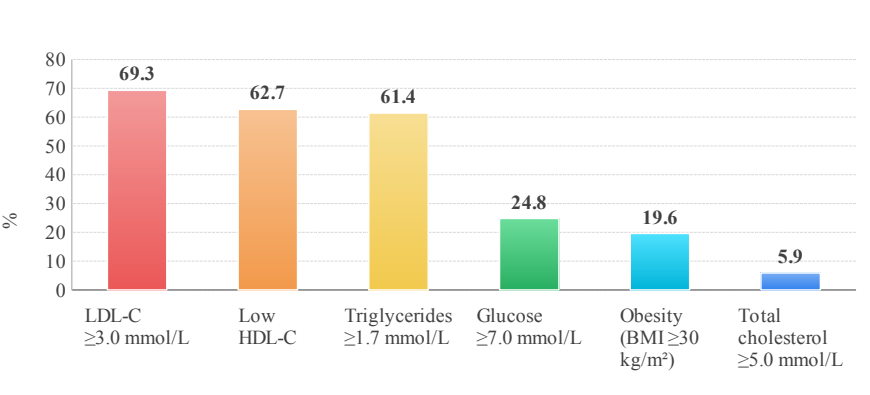
The metabolic risk domain was pronounced and evenly distributed: obesity (BMI ≥30 kg/m2) was present in 19.6%, glucose ≥6.1 mmol/L in 34.6%, ≥7.0 mmol/L in 24.8%, LDL-C ≥3.0 mmol/L in 69.3%, low HDL-C in 62.7% and triglycerides ≥1.7 mmol/L in 61.4%, whereas total cholesterol ≥5.0 mmol/L was found in only 5.9%; urea >8.3 mmol/L was detected in 28.8% (Figure 2). The median number of simultaneously present risk factors was 5 [4; 6] in all groups; 82–92% of the subjects had 3–6 factors. The total risk factor burden correlated most closely with BMI (r=0.640; p<0.001) and LDL-C (r=0.374; p<0.001), and the Buss–Durkee score with BMI (ρ=0.448) and glycemia (ρ=0.340; both p<0.001). Functional status by the Barthel Index was high (Me 95 [93; 98]) and inversely related to urea (ρ=−0.468) and creatinine (ρ=−0.343).
In univariate analysis, EF <50% was recorded in 80.7% of patients with IVST ≥14 mm versus 42.9% with a smaller thickness (OR 5.58; 95% CI 2.71–11.50; p<0.001), whereas LVMI ≥135 g/m2 (OR 0.10), glucose ≥7.0 mmol/L (OR 0.26) and dyslipidemia by ≥2 criteria (OR 0.33) were inversely associated with reduced EF. The independent predictors of functional and electrocardiographic deterioration are presented in Table 2.
| Predictor | OR | 95% CI | p |
|---|---|---|---|
| Outcome: EF <50% (AUC 0.905) | |||
| IVST (per 1 mm) | 1.60 | 1.32–1.95 | <0.001 |
| LVMI (per 10 g/m2) | 0.27 | 0.15–0.46 | <0.001 |
| Glucose (per 1 mmol/L) | 0.51 | 0.34–0.76 | <0.001 |
| Age (per 1 year) | 0.92 | 0.82–1.02 | 0.116 |
| Male sex | 0.97 | 0.25–3.78 | 0.963 |
| Outcome: QRS >0.12 s (AUC 0.918) | |||
| Grade 2 hypertension | 26.71 | 3.32–214.81 | 0.002 |
| IVST (per 1 mm) | 1.97 | 1.51–2.56 | <0.001 |
| LVMI (per 10 g/m2) | 3.02 | 1.18–7.73 | 0.021 |
| CHD (presence) | 0.08 | 0.01–0.45 | 0.004 |
| Age (per 1 year) | 1.11 | 0.95–1.30 | 0.190 |
| Male sex | 0.50 | 0.11–2.34 | 0.377 |
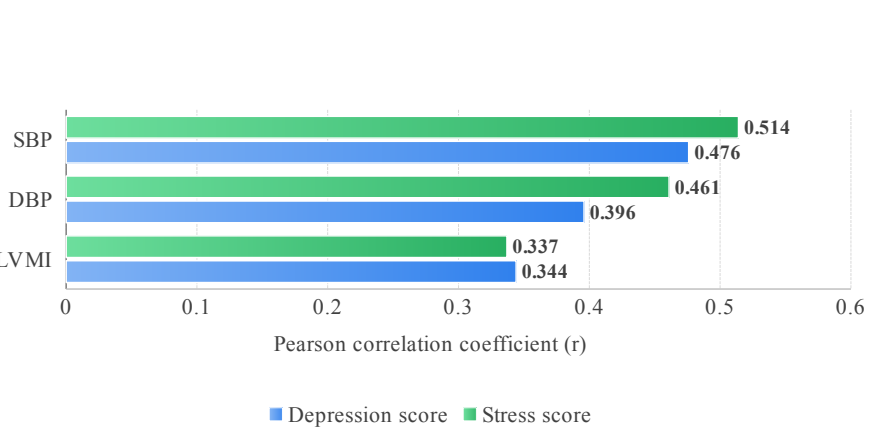
Psychoemotional indices were coupled with BP level and myocardial structure (Figure 3): the closest association was between the stress score and SBP (r=0.514); SBP in turn correlated with LVMI (r=0.497), and the stress and depression scores with each other (r=0.735).
Mean SBP and DBP in the dataset were 150.08±8.97 and 96.64±6.55 mm Hg, and the proportion of uncontrolled grade 2 hypertension by office thresholds was 36.7% (55/150). In the logistic model, the stress score was an independent predictor of grade 2 hypertension (β=0.0812; OR 1.085 per point; 95% CI 1.024–1.149; p=0.006), whereas the depression score lost significance when included jointly (β=0.0190; p=0.591). A 10-point increase in the stress score corresponded to a 2.25-fold increase in the odds of grade 2 hypertension. The model had satisfactory discriminative ability (AUC 0.707); at a threshold of p=0.313, sensitivity was 0.800, specificity 0.568 and negative predictive value 0.831.
Penitentiary modifiers were introduced as group corrections to the logit: relative to women, the odds of grade 2 hypertension were higher in short-term men (OR 2.611; 95% CI 0.872–7.816) and especially in long-term men (OR 3.333; 95% CI 1.123–9.898), corresponding to δ=0.960 and δ=1.204. The final probability was calculated as p = 1/(1 + exp(−z)), where z = −5.5757 + 0.0812·Stress + 0.0190·Depression + δ. The dependence of the final probability on the stress level at the mean depression score (49.86 points) is shown in Figure 4.
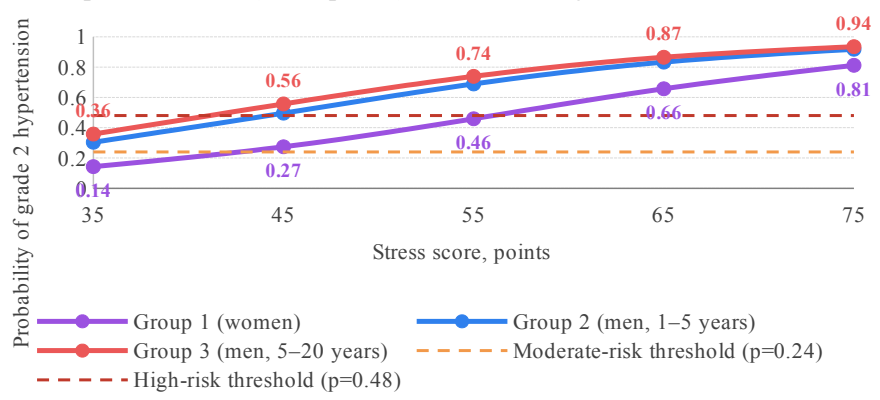
Already at 45 points the probability was 0.27 for women, 0.50 for short-term men and 0.56 for long-term men; at 65 points and above it exceeded 0.83 in the male groups. Based on the quartile distribution of probabilities, categories of low (p<0.24), moderate (0.24–0.47) and high (≥0.48) risk were defined, each matched with a schedule for the frequency of BP monitoring (from once daily to ≥4 times daily during the first 72 h), organizational control of medication intake, the obligatory psychological correction module and the scope of laboratory and instrumental examination. The calculation is implemented as an electronic calculator for the workstation of the medical unit physician.
Discussion
The data obtained characterize the penitentiary contingent with hypertension as a population with already established organ damage: LVH in 90–100%, EF <50% in two thirds and QRS widening in 60% of the subjects against a background of near-universal coronary pathology. Such a density of unfavorable signs exceeds that described in the general population of comparable age and agrees with reports of an increased burden of cardiovascular and metabolic disease among prisoners [3–5]. At the same time, intergroup differences were realized not through the stage of HD or mean instrumental indices but through the accumulation of combined diagnoses: the length of isolation in men emerged as an independent marker of comorbidity ≥3 and of the CHD + angina + T2DM profile. This allows the term of imprisonment to be regarded as an integral index of cumulative exposure to a stressogenic environment, limited dietary modification and poor adherence, as also noted in WHO documents on prison health [7].
The opposite associations of IVST and LVMI with reduced EF reflect the heterogeneity of hypertensive remodeling: the variant with predominant septal thickening was accompanied by functional decline, whereas “mass” hypertrophy with relatively preserved contractility corresponds to a compensatory trajectory. The high discriminative ability of the models for EF <50% (AUC 0.905) and QRS >0.12 s (AUC 0.918) provides a practical tool for prioritizing echocardiographic and ECG monitoring under resource constraints. The inverse association of CHD with QRS prolongation after adjustment for the grade of hypertension and hypertrophy indicates that QRS widening in this sample corresponded to a hypertensive-hypertrophic rather than an ischemic phenotype.
The association of the stress score with SBP and LVMI and its independent prognostic role are consistent with the neurohumoral mechanisms of stress-induced hypertension [8] and with the results of a meta-analysis showing an increased risk of hypertension under psychosocial stress [9]. The loss of significance of the depression component when included jointly is explained by the high collinearity of the scales (r=0.735). The moderate AUC of the psychoemotional model is offset by the high sensitivity of the chosen threshold, which suits the screening task: in a specialized hospital, the cost of missing uncontrolled hypertension is expressed in more emergency calls and a heavier load on the medical unit.
The limitations of the study are its single-center cross-sectional design, the small size of the female group, the recording of the grade of hypertension during ongoing therapy and the lack of external validation of the model, which determines the need for multicenter verification of the proposed scheme.
Conclusion
- Hypertension in persons held in penitentiary institutions is characterized by the predominance of grade 2 hypertension (78.4%) and stage III HD (64.1%), almost universal left ventricular hypertrophy and EF <50% in 62.5–65.0% of patients, with a high prevalence of atherogenic dyslipidemia and hyperglycemia; the profile of target-organ damage does not depend on sex or length of imprisonment.
- A long term of imprisonment (5–20 years) in men is an independent predictor of comorbidity ≥3 (OR 6.00; p=0.023) and of the CHD + angina + T2DM cardiometabolic profile (OR 10.82; p=0.006).
- The probability of EF <50% is determined by IVST, LVMI and glycemia (AUC 0.905), and the probability of QRS >0.12 s by grade 2 hypertension and hypertrophy markers (AUC 0.918), which defines the criteria for intensified cardiac monitoring.
- The stress score is an independent predictor of uncontrolled grade 2 hypertension (OR 1.085 per point; 2.25-fold per 10 points); integration of the psychoemotional model with group corrections (δ=0.960 and 1.204 for short- and long-term men) makes it possible to calculate the individual probability and translate it into a schedule of BP monitoring, psychological correction and examination.