
Full text
Introduction
Sleep is included in contemporary assessment of cardiovascular health alongside blood pressure, lipids, glycaemia and lifestyle [1]. In service populations, both individual risk factors and timely completion of examinations when these factors coexist are important.
Among police officers, sleep disorders are associated with adverse health and safety measures, but a positive questionnaire result is not equivalent to an established disease [2]. Occupational strain also requires separate consideration. In the five-year police study by Garbarino and Magnavita, the association between work stress and metabolic syndrome persisted after statistical adjustment; however, this observation alone does not establish the causal contribution of each component of duty-related workload [3].
Two studies with available original counts are of interest for quantitative clarification. CHIEF compared cardiometabolic measures across OSA risk categories, while the Southern China police study described the transition from questionnaires to home respiratory recording [4, 5]. These datasets address different questions. The former supports calculation of between-group differences, the latter assessment of diagnostic attrition. Combining them into a single prevalence estimate would be methodologically unjustified.
OSA and hypertension are considered clinically related conditions [6]. However, the 2024 European and 2025 American guidelines use different thresholds for office BP classification [7, 8]. Conclusions about the magnitude of the association therefore depend on both sample composition and the selected outcome definition. A further difficulty is the conflation of three concepts: questionnaire-defined risk, instrumentally recorded breathing abnormalities and clinical diagnosis [9].
Insufficient evidence to support population-wide screening of asymptomatic adults does not preclude clinically indicated examination [10]. In occupational medicine, it is important to establish the stage at which already referred personnel are lost from the diagnostic pathway. This study aimed to recalculate cardiometabolic differences, examine the sensitivity of results to BP thresholds and quantify incomplete diagnosis using published data.
Materials and Methods
Design and source selection
A secondary analysis of aggregate results was performed. Two studies [4, 5] were purposively selected from the relevant literature using three criteria: active-duty military personnel or police officers, OSA risk assessment, and counts or means with standard deviations sufficient for recalculation. Full texts, tables and bibliographic details were checked against publisher websites and PubMed on 11 September 2026. This work is not a systematic review or meta-analysis; comprehensive coverage of all studies is not claimed.
The unit of extraction was the published group, not an individual medical record. The sources describe 1782 people in total, but calculations were performed separately for 746 and 1036 participants. No new examinations were conducted at the Central Hospital. Individual-level data, follow-up events and joint distributions of risk factors were unavailable [4, 5].
| Parameter | Primary studies | Interpretive limitation | |
|---|---|---|---|
| CHIEF [4] | Southern China police [5] | ||
| Period and design | 2020; cross-sectional study | 2017; cross-sectional examination with two-stage diagnosis | Temporal sequence of factors and outcomes not established |
| Analytical sample | 746; low risk 686, high risk 60 | 1036; low risk 808, high risk 228 | No pooled overall frequency calculated |
| Age, years; men | Mean 27.9; 656 (87.9%) | 40.7±9.1; 799 (77.1%) | Age and sex composition differ |
| OSA risk definition | Berlin Questionnaire | Berlin Questionnaire | Questionnaire category is not a diagnosis |
| OSA verification | Instrumental verification not reported | HSAT; usable recording in 152; OSA at AHI ≥5/h in 103 | Confirmed OSA cannot be compared between samples |
| BP assessment | Measurement at examination; thresholds 140/90 and 130/80 | Repeat measurements; BP ≥140/90 or antihypertensive treatment | CHIEF analyses a threshold phenotype, not newly confirmed hypertension |
| Available information | Counts by threshold; M±SD of anthropometric and laboratory measures | Counts by diagnostic stage; hypertension and its prior treatment | Individual adjustment and interaction testing unavailable |
Note. OSA, obstructive sleep apnoea; HSAT, home sleep apnoea testing; AHI, apnoea–hypopnoea index; M±SD, mean and standard deviation. Values were taken from the primary publications [4, 5].
Definitions and comparability checks
High risk was defined using the Berlin Questionnaire. Its third category incorporates obesity or a history of hypertension; the association between questionnaire-defined risk and BP may therefore be partly embedded in the instrument itself [11]. CHIEF separately analysed exceedance of at least one threshold and simultaneous systolic and diastolic BP elevation. Reporting of sources, missing data and limitations was aligned with applicable STROBE provisions [12].
Statistical analysis
Frequencies are presented as n/N and percentages with 95% Wilson CIs [13]. For independent groups, PR=(a/n₁)/(c/n₀), where a and c denote outcome counts and n₁ and n₀ are the high- and low-risk group sizes. PR CIs were calculated on the logarithmic scale; CIs for differences in proportions used Newcombe’s method based on Wilson intervals [14]. Four BP comparisons were tested using two-sided Fisher’s exact tests; p-values were adjusted by the Holm method [15]. Continuous measures were compared using Hedges’ g, with a positive sign indicating a higher value in the high-risk group; the CI was based on an approximate standard error [16].
The g estimates are unadjusted and exploratory. Missing examinations were not replaced with negative results. The scenario probability of OSA among the 76 individuals without verification was varied from 0 to 1; the observed frequency of 103/152 among examined participants was also used. Calculations were performed in Python; original numbers were retained in editable chart datasets.
Results
Cardiometabolic differences in CHIEF
High OSA risk was recorded in 60 of 746 military personnel (8.0%). Mean age in this group was 30.45±5.86 years, compared with 27.67±5.74 years in the low-risk group. The following differences therefore cannot be interpreted as the isolated effect of sleep-disordered breathing [4].
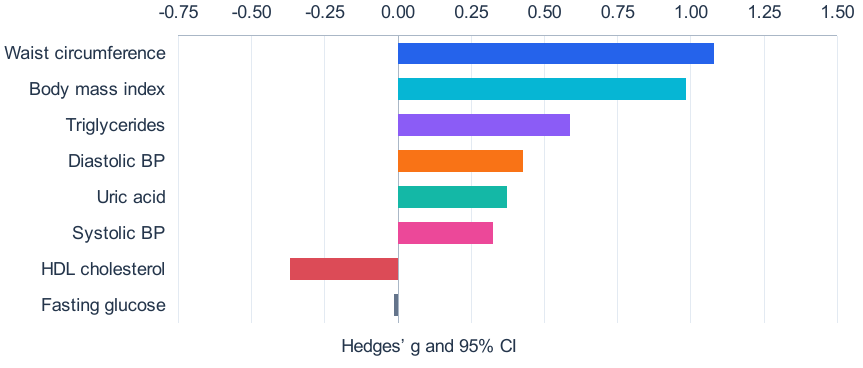
Note. Calculations used published M±SD [4]. Bars represent Hedges’ g; horizontal error bars indicate 95% CIs. A negative difference in HDL cholesterol has an adverse clinical direction. The groups were not matched for age or obesity.
The largest difference concerned waist circumference. It was 92.04±13.79 cm in the high-risk group and 81.20±9.63 cm in the low-risk group; the absolute difference was 10.84 cm, g=1.08 (95% CI 0.81–1.35). Body mass index differed by 3.64 kg/m², at 27.75±4.27 versus 24.11±3.65 kg/m²; g=0.98 (0.71–1.25). These estimates describe a substantial shift in the anthropometric profile, not the frequency of clinically diagnosed obesity [4, 16].
Triglycerides were higher by 45.00 mg/dL, at 143.65±122.28 versus 98.65±71.06 mg/dL; g=0.59 (0.32–0.85). HDL cholesterol, conversely, was lower by 3.98 mg/dL; g=−0.37 (−0.63 to −0.11). The large triglyceride standard deviation requires caution: published means do not allow examination of distributional skewness or robustness to outliers [4].
Differences in diastolic and systolic BP were 3.98 and 4.09 mmHg, respectively; g=0.43 (0.16–0.69) and 0.33 (0.06–0.59). For uric acid, g=0.37 (0.11–0.64). Fasting glucose was virtually identical: 94.75±10.12 versus 94.90±10.00 mg/dL; g=−0.015 (−0.279 to 0.249). The between-group contrast was therefore not uniform across all metabolic measures [4].
Quantitative ranking distinguishes anthropometric differences from BP and glycaemic changes. It does not replace diagnostic criteria for metabolic syndrome. Calculating its frequency would require knowledge of feature combinations in each participant, which the published tables do not provide [4].
BP threshold criteria and between-group contrast
| Criterion, mmHg | Low risk, n=686 | High risk, n=60 | PR (95% CI) |
Difference, pp (95% CI) |
pHolm | ||
|---|---|---|---|---|---|---|---|
| n | % | n | % | ||||
| SBP ≥140 or DBP ≥90 | 29 | 4.2 | 10 | 16.7 | 3.94 (2.02–7.69) | 12.44 (4.87–23.87) | 0.0021 |
| SBP ≥140 and DBP ≥90 | 2 | 0.3 | 3 | 5.0 | 17.15 (2.92–100.65) | 4.71 (1.34–13.41) | 0.0132 |
| SBP ≥130 or DBP ≥80 | 147 | 21.4 | 17 | 28.3 | 1.32 (0.86–2.03) | 6.90 (−3.44…19.67) | 0.2540 |
| SBP ≥130 and DBP ≥80 | 44 | 6.4 | 10 | 16.7 | 2.60 (1.38–4.90) | 10.25 (2.61–21.73) | 0.0152 |
Note. Original counts are from CHIEF [4]. PR, prevalence ratio; pp, percentage points. The p-values are Holm-adjusted for four comparisons. Thresholds are nested; rows do not represent independent samples.
At the 140/90 threshold, the frequency of exceeding at least one BP component was almost four times higher in the high-risk group. At the 130/80 threshold, the difference decreased and its CI included no association. This change describes sensitivity to the outcome definition; a separate test of interaction between threshold and questionnaire-defined risk was not performed [4].
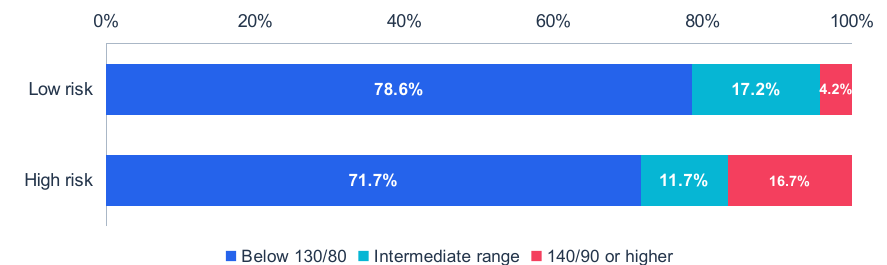
Note. The intermediate range denotes SBP 130–139 or DBP 80–89 in the absence of SBP ≥140 and DBP ≥90. The upper range includes exceedance of at least one 140/90 threshold. Low and high risk were defined by the Berlin Questionnaire; calculations used [4].
For simultaneous SBP and DBP elevation at the 140/90 threshold, the PR was 17.15, but only five such observations were recorded. The wide CI of 2.92–100.65 precludes precise estimation of the association. This finding is unsuitable for individual prediction.
The audit identified a discrepancy between the original tables. Counts of 10/60 and 29/686 yield an unadjusted odds ratio of 4.53, whereas the source regression table reports 4.28. At the 130/80 threshold, the corresponding values are 1.45 and 1.38. The discrepancy cannot be explained without individual-level data; this analysis used published counts rather than a reconstructed regression [4].
Attrition during instrumental verification in police officers
In the police sample, high questionnaire-defined risk was recorded in 228 of 1036 officers. A total of 156 consented to home recording, and analysable recordings were obtained from 152. Thus, 72 officers declined examination, and four further results were technically unusable. Total attrition was 76 of 228, or 33.3% (95% CI 27.5–39.7) [5].
| Stage or result | Count | Frequency | 95% CI | Denominator | |
|---|---|---|---|---|---|
| n | N | % | % | ||
| High questionnaire risk | 228 | 1036 | 22.0 | 19.6–24.6 | All screened |
| Consent to HSAT | 156 | 228 | 68.4 | 62.1–74.1 | High-risk individuals |
| Technically usable HSAT | 152 | 228 | 66.7 | 60.3–72.5 | High-risk individuals |
| Verification incomplete | 76 | 228 | 33.3 | 27.5–39.7 | High-risk individuals |
| OSA at AHI ≥5/h | 103 | 152 | 67.8 | 60.0–74.7 | Individuals with usable recordings |
| Detected OSA in the full sample | 103 | 1036 | 9.94 | 8.27–11.91 | All screened |
| Hypertension among those with OSA | 49 | 103 | 47.6 | 38.2–57.1 | Individuals with detected OSA |
| Newly diagnosed hypertension | 15 | 49 | 30.6 | 19.5–44.5 | Coexisting OSA and hypertension |
| Hypertension without prior treatment | 27 | 49 | 55.1 | 41.3–68.1 | Coexisting OSA and hypertension |
Note. Original counts are from [5]; 95% CIs were recalculated using the Wilson method [13]. Initial stages are nested. Newly diagnosed and previously untreated hypertension categories may overlap; their counts should not be summed.
Among the 152 officers with usable recordings, OSA was identified in 103 using the source threshold of AHI ≥5/h. The 67.8% frequency characterises the examined subgroup, not the entire service population. The value 103/1036, or 9.94%, is the observed minimum diagnostic yield of the applied pathway. It is not an unbiased estimate of OSA prevalence because most participants did not undergo instrumental examination [5, 9].
Hypertension was present in 49 of the 103 individuals with detected OSA. In 15 of these 49 officers, it had not previously been diagnosed; 27 had not received prior antihypertensive treatment. This is a separate finding of the examination pathway. It concerns officers actually examined and requires no assumptions about the health of those who declined [5].
Each detected OSA case corresponded to 10.06 initial screening examinations and 1.48 usable home recordings. Each newly diagnosed hypertension case among individuals with OSA corresponded to 69.07 screening examinations. These ratios describe the workload of this pathway; they are not numbers needed to treat and do not estimate prevented cardiovascular events [5].
Scenario assessment of incomplete diagnosis
Uncertainty for the 76 high-risk officers is expressed as q, the probability of a positive result if examination is completed. Expected diagnostic yield per 100 initially screened individuals is D(q)=100×(103+76q)/1036. As q varies from 0 to 1, yield ranges from 9.94 to 17.28. These are bounds for the conditional examination result in the high-risk group, not bounds for the true prevalence of OSA in the entire sample [5].
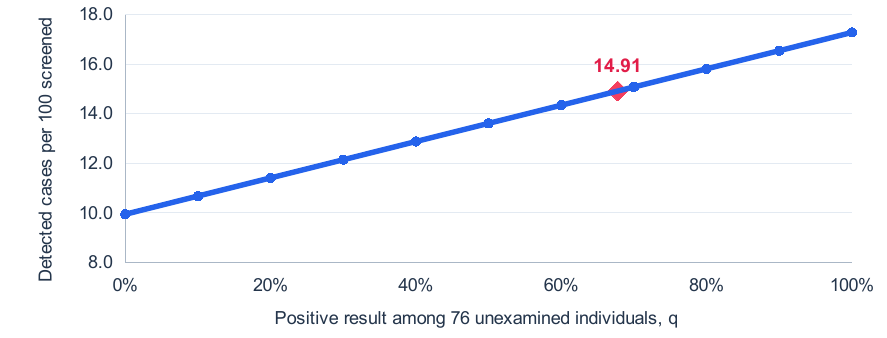
Note. All line values, except the observed starting point of 9.94, are calculated scenarios. The diamond corresponds to q=103/152=67.8%. OSA status remains unknown for the 808 participants with low questionnaire-defined risk [5].
At q=103/152, an additional 51.5 cases and 154.5 cases in total are expected, or 14.91 per 100 screened. Fractional numbers represent mathematical expectations, not counts of people actually examined. The conditional increase is 4.97 percentage points, or 50% relative to the observed yield of 9.94. Equal detection rates among those consenting and those declining have not been verified; statistical precision intervals for this scenario should not be interpreted as eliminating selection bias [5].
Discussion
The secondary analysis distinguishes the clinical and organisational aspects of the problem. In CHIEF, questionnaire-defined risk was associated primarily with differences in waist circumference, body mass index and lipids. In the police sample, substantial attrition occurred before a usable instrumental recording was obtained. Neither finding means that the questionnaire measures the severity of nocturnal hypoxia. Features of hypoxic burden beyond AHI alone may be important for cardiovascular prognosis [17].
Causal interpretation requires a different design. Unlike the prospective study by Peppard et al., the present data do not establish whether breathing disturbances preceded BP elevation [18]. In addition, inclusion of hypertension and obesity in the Berlin Questionnaire makes the classification partly dependent on the outcome under study [11]. The calculated PRs therefore cannot be described as independent risks of developing hypertension.
Threshold sensitivity has practical importance. High questionnaire-defined risk and BP elevation at one examination require clinical verification, not automatic assignment of a diagnosis. Repeat office and out-of-office measurements reduce classification uncertainty; the selected threshold must be explicitly stated when comparing studies [7, 8]. OSA diagnosis rests on clinical assessment and a sleep study, not on a questionnaire alone [9, 10].
Detecting OSA is not equivalent to preventing cardiovascular complications. In HIPARCO, CPAP in patients with resistant hypertension was associated with an additional reduction in mean 24-hour BP of 3.1 mmHg over 12 weeks [19]. However, SAVE and ISAACC did not establish a reduction in their primary composite cardiovascular event outcomes with CPAP in the respective populations [20, 21]. The primary intention-to-treat analysis in RICCADSA also found no statistically significant benefit [22]. These findings cannot be substituted for an effectiveness prediction in young military personnel.
Treatment decisions depend on symptoms, confirmed OSA and comorbid conditions. Positive airway pressure guidelines consider sleepiness, quality of life and hypertension as distinct treatment indications [23]. Interdisciplinary weight loss in INTERAPNEA reduced OSA severity [24]. SURMOUNT-OSA evaluated tirzepatide in adults with obesity and moderate or severe OSA [25]. These findings support individualised management of identified abnormalities but do not justify identical treatment for everyone with high questionnaire-defined risk.
Occupational medical services should monitor not only questionnaire coverage but also the availability of usable recordings after referral, reasons for declining and completion of hypertension confirmation. A sleep health programme in firefighters provides a useful organisational reference, but its result for disability days is not an evaluation of cardiovascular prevention [26]. Associations between sleep disorders and adverse outcomes in firefighters should likewise not be transferred to police officers without validation [27]. Sleep duration and quality remain separate components of prevention, not substitutes for OSA assessment [28].
Limitations
Sources were purposively selected; publication selection bias and incomplete representativeness are possible. The samples differ in age, sex and diagnostic procedures. Individual adjustment for obesity, age and duty-related workload was unavailable. In CHIEF, OSA was not instrumentally confirmed; rare combined BP phenotypes have wide CIs. Standardised differences across eight measures are exploratory, not confirmation of eight independent effects. In the police sample, 76 high-risk and 808 low-risk individuals were not examined. Intervention results, costs and long-term outcomes are unknown. Transfer of numerical estimates to Uzbekistan requires local validation [4, 5].
Conclusion
In CHIEF, high questionnaire-defined OSA risk was associated with marked anthropometric and moderate lipid differences, but not with increased mean glucose. The prevalence ratio for elevated BP was 3.94 at the 140/90 threshold and 1.32 at the 130/80 threshold. In the police sample, one-third of high-risk individuals did not complete instrumental diagnosis. The equal-detection scenario yields an additional 4.97 detected OSA cases per 100 screened; the clinical effectiveness of this organisational change has not yet been measured. Further research should prioritise completion of the pathway and its actual diagnostic outcomes.