
Full text
Introduction
Early blood pressure elevation requires assessment beyond a single office measurement. This approach has an important place in the ESC and ESH guidelines [1, 2]. In the CARDIA cohort, blood pressure in young adulthood was associated with cardiovascular events in subsequent years [3]. Nevertheless, short-term blood pressure change and long-term clinical outcomes represent different research questions.
In young adults, arterial stiffness is associated with subsequent blood pressure increases [4]. The preceding duration of elevated blood pressure also matters [5]. Central haemodynamics complement peripheral measurement but do not replace it [6]. In military personnel, the combination of these features with night-time duties, impaired recovery and laboratory signs of inflammation is of particular interest.
Materials and Methods
The article draws on aggregate results from a two-stage prospective study conducted within the military medical system of the Tashkent garrison in 2023–2025. Of 302 individuals examined, 42 were excluded before formation of the analytical sample. The baseline analysis included 260 men aged 18–30 years. At six months, 223 were reassessed; 37 were lost to follow-up because of reassignment, discharge or inability to undergo repeat monitoring. Participant flow and the distinction between baseline and follow-up assessments are reported in accordance with STROBE principles [7].
Inclusion required written informed consent, the ability to complete the examination and no antihypertensive treatment at baseline. Exclusion criteria were acute infection during the preceding 14 days, exacerbation of a chronic disease, use of drugs substantially affecting blood pressure, suspected secondary hypertension, major endocrine or renal disease, and incomplete examination results.
Blood pressure was assessed at rest and by ambulatory monitoring. Standardised measurement is essential for reproducible classification [8]. Hypertension was operationally defined as office systolic blood pressure (SBP) ≥140 or diastolic blood pressure (DBP) ≥90 mmHg, or mean 24-hour SBP ≥130 or DBP ≥80 mmHg. After excluding hypertension, high-normal blood pressure was defined as office SBP ≥130 or DBP ≥85, or mean 24-hour SBP ≥125 or DBP ≥75 mmHg. These working categories were retained from the protocol rather than redefined using later guidelines [1, 2].
A non-dipping profile was defined as a nocturnal SBP decline of less than 10% relative to the daytime level. Separate assessment of night-time blood pressure is supported by studies of ambulatory haemodynamics [9] and nocturnal phenotypes [10]. The mean of right- and left-sided CAVI measurements was calculated; pulse wave velocity (PWV), central SBP and AIx@75 were also measured. The methodological basis of CAVI was described by K. Shirai et al. [11]. The CAVI ≥6.20 threshold for early vascular ageing (EVA) was a research criterion, not a universal age-specific reference value. Limitations related to blood pressure dependence [12] and population differences in reference values [13] were considered.
Blood measurements included hsCRP, IL-6, TNF-α, IL-18, the white blood cell profile and cortisol at 08:00. SDNN, RMSSD, LF/HF, PSS-10, sleep and night duties were assessed. High stress was recorded when at least one criterion was present: PSS-10 ≥20, cortisol ≥520 nmol/L, SDNN <40 ms, sleep <6 h, or ≥6 night duties in 30 days. Immune activation was defined as hsCRP ≥2 mg/L, IL-6 ≥3 pg/mL or NLR ≥2.4.
The 0–8-point score included blood pressure category (0, 1 or 2 points), non-dipping, EVA, high stress, immune activation, BMI ≥27 kg/m², and smoking or a positive family history (1 point each). Analyses used ANOVA or the Kruskal–Wallis test, χ² or Fisher’s exact test, correlations, and linear and logistic regression; p<0.05. Coefficients and p-values were retained from the original tables. Wilson intervals, threshold performance and an empirical ROC curve were additionally calculated from the reported absolute frequencies. Individual records were not reconstructed. Model interpretation took account of TRIPOD+AI requirements [14].
Results
Clinical profile and vascular phenotypes
Hypertension was identified in 61 of 260 military personnel (23.5%), and high-normal blood pressure in 70 (26.9%). Participants with hypertension were older and had a higher BMI. They had 4.3±2.0 night duties per month, compared with 2.7±1.7 in the normal blood pressure group. The difference in sleep duration did not reach the prespecified significance level (p=0.052).
| Assessment domain | Baseline blood pressure category | Test | ||
|---|---|---|---|---|
| Measure | Normal BP n=129 |
High-normal BP n=70 |
Hypertension n=61 |
p |
| Clinical and duty-related characteristics | ||||
| Age, years | 20.8±2.7 | 22.4±3.3 | 24.9±3.4 | <0.001 |
| BMI, kg/m² | 22.0±2.0 | 22.5±2.4 | 24.1±2.2 | <0.001 |
| Night duties / 30 days | 2.7±1.7 | 3.1±1.7 | 4.3±2.0 | <0.001 |
| PSS-10, points | 12.7±4.1 | 13.1±3.9 | 15.6±4.3 | <0.001 |
| Haemodynamics and arterial stiffness | ||||
| Office SBP, mmHg | 118.6±5.3 | 125.1±7.3 | 133.4±8.6 | <0.001 |
| Mean 24-h SBP, mmHg | 113.6±5.8 | 119.6±7.4 | 129.6±8.6 | <0.001 |
| Central SBP, mmHg | 109.7±6.6 | 116.6±7.7 | 125.1±10.1 | <0.001 |
| Mean CAVI | 5.6±0.3 | 5.8±0.4 | 6.2±0.5 | <0.001 |
| PWV, m/s | 5.5±0.5 | 5.7±0.6 | 6.2±0.7 | <0.001 |
Data are presented as M±SD. The p-value refers to the three-group comparison, not to each pairwise comparison. The precision of CAVI and PWV values follows Table 3.2 of the original study.
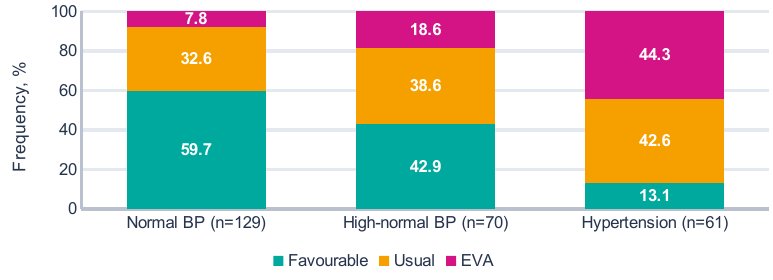
Phenotypes were defined using the working CAVI thresholds. Percentages were calculated from absolute counts; totals may differ slightly from 100% because of rounding.
EVA was detected in 10 of 129 participants with normal blood pressure, 13 of 70 with high-normal blood pressure and 27 of 61 with hypertension. EVA frequency in the high-normal group was 18.6%. The absence of hypertension therefore did not exclude this research-defined vascular phenotype.
Immunoinflammatory and stress-related measures
Laboratory differences were not uniform across the panel. Mean hsCRP and TNF-α were higher in participants with hypertension than in those with normal blood pressure. The between-group p-value was 0.053 for IL-6 and 0.174 for IL-18. The direction of the mean values for these cytokines is therefore not interpreted as a statistically confirmed difference.
| Parameter | Baseline values, M±SD | Three groups | ||
|---|---|---|---|---|
| Measure | Normal BP n=129 |
High-normal BP n=70 |
Hypertension n=61 |
p |
| Laboratory measures | ||||
| White blood cells, 10⁹/L | 5.6±0.9 | 5.5±0.9 | 6.0±0.8 | <0.001 |
| hsCRP, mg/L | 1.2±0.7 | 1.2±1.0 | 1.6±1.3 | 0.005 |
| IL-6, pg/mL | 1.6±0.6 | 1.6±0.9 | 1.9±0.9 | 0.053 |
| TNF-α, pg/mL | 5.8±1.4 | 5.5±1.4 | 6.3±1.4 | 0.004 |
| IL-18, pg/mL | 180.5±37.9 | 177.5±37.8 | 189.6±40.7 | 0.174 |
| NLR | 1.5±0.3 | 1.5±0.3 | 1.5±0.2 | 0.720 |
| Hormonal and autonomic measures | ||||
| Cortisol at 08:00, nmol/L | 299.2±69.3 | 322.9±61.5 | 351.7±80.3 | <0.001 |
| SDNN, ms | 77.8±13.0 | 76.1±12.8 | 70.7±14.3 | 0.003 |
| RMSSD, ms | 44.2±10.3 | 43.6±10.6 | 41.5±9.5 | 0.241 |
| LF/HF | 1.3±0.7 | 1.4±0.7 | 1.8±0.9 | <0.001 |
hsCRP, high-sensitivity C-reactive protein; NLR, absolute neutrophil-to-lymphocyte ratio; SDNN and RMSSD, time-domain heart rate variability measures; LF/HF, ratio of spectral components. The p-values were taken from Table 3.3 of the original study.
The most consistent differences concerned cortisol, SDNN and LF/HF. Cortisol differed by 52.5 nmol/L and SDNN by 7.1 ms between the extreme groups. Lower SDNN was accompanied by higher LF/HF, but these values alone do not identify a specific mechanism of autonomic dysfunction without considering recording conditions.
Operationally defined high stress was identified in 25 participants with normal blood pressure (19.4%), 10 with high-normal blood pressure (14.3%) and 23 with hypertension (37.7%; p=0.003). Immune activation occurred in 17 (13.2%), 9 (12.9%) and 15 (24.6%), respectively; the overall difference was not significant (p=0.097). Continuous marker values and the frequency of exceeding selected thresholds characterised different aspects of the laboratory profile.
Mean CAVI correlated with PWV (r=0.74), mean 24-hour SBP (r=0.53), hsCRP (r=0.31), IL-6 (r=0.21) and the number of night duties (r=0.41). Cortisol was associated with PSS-10 (r=0.64) and night duties (r=0.60), and inversely associated with sleep duration (r=−0.40); all listed associations had p<0.001. These associations concern the baseline examination and do not establish the temporal sequence of changes.
Non-dipping was recorded in 44 of 129 participants with normal blood pressure, 18 of 70 with high-normal blood pressure and 34 of 61 with hypertension. Frequencies of 34.1%, 25.7% and 55.7% did not form a uniform gradient. The nocturnal profile was therefore assessed separately from baseline blood pressure category.
Multivariable analysis and the six-month outcome
In the linear model of mean 24-hour SBP, independent associations persisted for age, BMI, the number of night duties and CAVI. Adjusted R² was 0.363. In the prognostic analysis, the endpoint occurred in 76 of 223 participants. Baseline blood pressure category and non-dipping remained significant after the other variables were entered jointly.
| Factor | Estimate | Uncertainty measure | p |
|---|---|---|---|
| A. Baseline mean 24-h SBP • linear model, n=260 | |||
| Age, per 1 year | B=0.657 | SE=0.174 | <0.001 |
| BMI, per 1 kg/m² | B=0.528 | SE=0.243 | 0.031 |
| Night duties, per 1 / month | B=0.733 | SE=0.368 | 0.048 |
| CAVI, per 1 unit | B=5.390 | SE=1.490 | <0.001 |
| B. Adverse change over 6 months • logistic model, n=223 | |||
| High-normal BP / hypertension | OR=4.596 | 95% CI 2.199–9.606 | <0.001 |
| Non-dipper | OR=2.700 | 95% CI 1.376–5.297 | 0.004 |
| EVA | OR=2.115 | 95% CI 0.958–4.668 | 0.064 |
| High stress | OR=1.383 | 95% CI 0.646–2.964 | 0.404 |
| Immune activation | OR=1.012 | 95% CI 0.427–2.396 | 0.979 |
| BMI ≥27 kg/m² | OR=1.567 | 95% CI 0.380–6.471 | 0.535 |
| Smoking / family history | OR=1.498 | 95% CI 0.805–2.789 | 0.202 |
B, unstandardised coefficient; SE, standard error; OR, odds ratio. The linear model also included PSS-10, sleep, hsCRP, IL-6, cortisol and SDNN; their p-values were >0.05. Part B presents all seven factors from a single model. An OR is not a ratio of probabilities.
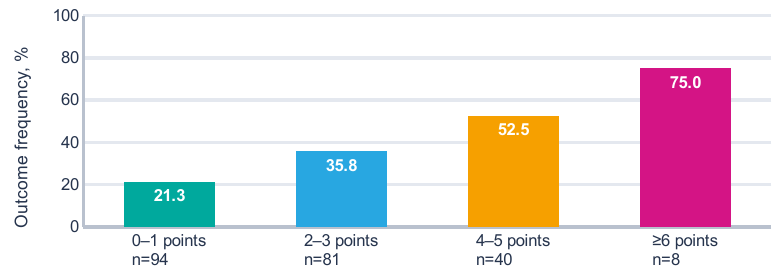
Bars correspond to 20/94, 29/81, 21/40 and 6/8 outcomes. Error bars indicate 95% Wilson intervals additionally calculated from absolute frequencies.
At ≥6 points, outcome frequency reached 75.0%, but this estimate was based on only eight observations; its 95% CI was 40.9–92.9%. Even at 0–1 points, the endpoint occurred in 21.3% of participants. A low score category therefore did not remove the need for repeat assessment.
Score discrimination and threshold selection
The ROC curve reconstructed from the distribution of events and non-events yielded AUC=0.67817, consistent with the rounded estimate in the original study. The ≥2-point threshold had the highest Youden index among the reported integer thresholds. At this threshold, 129 of 223 participants tested positive, including 56 who subsequently experienced the outcome and 73 who did not.
| Points | Absolute counts | Diagnostic performance | Predictive value | |||
|---|---|---|---|---|---|---|
| Cut-off | TP / FN | TN / FP | Sensitivity %, 95% CI |
Specificity %, 95% CI |
PPV % |
NPV % |
| ≥2 | 56 / 20 | 74 / 73 | 73.7 62.8–82.3 | 50.3 42.4–58.3 | 43.4 | 78.7 |
| ≥4 | 27 / 49 | 126 / 21 | 35.5 25.7–46.7 | 85.7 79.1–90.5 | 56.3 | 72.0 |
| ≥6 | 6 / 70 | 145 / 2 | 7.9 3.7–16.2 | 98.6 95.2–99.6 | 75.0 | 67.4 |
TP/FN, true positives / false negatives; TN/FP, true negatives / false positives. PPV and NPV, positive and negative predictive values. All values were calculated from Table 4.4 of the dissertation, n=223; CIs were calculated using the Wilson method.
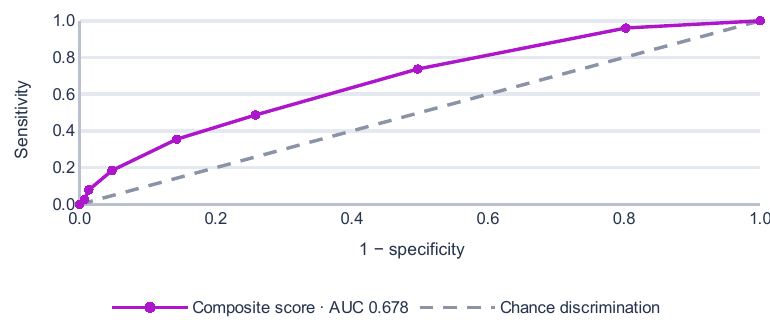
Points correspond to the observed thresholds of the 0–7 score range. Original event and non-event frequencies were used, without simulating individual observations or applying smoothing.
Raising the threshold to ≥4 points increased specificity to 85.7% but reduced sensitivity to 35.5%. At ≥6 points, only 6 of 76 outcomes were identified. A high threshold may therefore identify a small subgroup for more detailed follow-up, but is unsuitable as the sole population-wide screening criterion.
The positive likelihood ratio at ≥2 points was 1.48. This represents a limited change in prior odds, not an independent basis for diagnosis. Threshold selection should account for missed outcomes and the volume of subsequent examinations. Discrimination, calibration and clinical utility are not interchangeable model characteristics [14, 15].
The original study proposed scheduled monitoring at 0–1 points, repeat ambulatory monitoring after six months at 2–3 points, more frequent follow-up at 4–5 points and detailed examination at ≥6 points. Here, this is regarded as a research framework for organising follow-up. Whether its implementation reduces morbidity was not assessed in the present dataset.
Discussion
The principal finding is the distinction between characterising baseline status and predicting its change. CAVI, hsCRP, cortisol and SDNN differentiated some baseline groups, but blood pressure category and the nocturnal profile were the most robust factors in the logistic model. This pattern preserves the clinical value of extended assessment without turning every laboratory association into an independent prognostic factor.
The association between early blood pressure elevation and subsequent events in CARDIA supports attention to young adulthood [3]. However, the endpoint of this study was limited to six-month blood pressure change. It is not equivalent to myocardial infarction, stroke or target-organ damage. The association of baseline high-normal blood pressure with this endpoint characterises short-term haemodynamic instability rather than providing a quantitative prediction of distant complications.
The independent importance of non-dipping is consistent with the direction of ambulatory blood pressure research [9]. In JAMP, nocturnal blood pressure and features of the nocturnal phenotype had distinct prognostic value [10]. Direct comparison of effect sizes is nevertheless limited by differences in age and endpoints. Non-dipping also occurred at normal blood pressure in the present sample; its assessment should therefore not be restricted to further description of established hypertension.
Night duties provide a possible context for this association. Experimental circadian misalignment was accompanied by increased blood pressure and inflammatory measures in healthy volunteers [16]. Similar changes have been described in chronic shift workers [17]. In the present dataset, the number of night duties was associated with cortisol and CAVI and retained an association with mean 24-hour SBP. This is consistent with a contribution from recovery patterns, but does not replace direct analysis of the causal effects of military duties.
Arterial stiffness may precede further blood pressure elevation, as reported by T. Koivistoinen et al. [4]. The effect of a prolonged history of elevated blood pressure on the arteries is supported by the Young Finns data [5]. Both directions of this association may have coexisted in our sample. The cross-sectional association between CAVI and SBP does not establish which change occurred first.
Device type and the arterial segment measured are important for valid comparison of vascular findings [18]. CAVI and PWV should not be treated as identical measures. Moreover, the original concept of relative independence of CAVI from current blood pressure [11] has undergone methodological refinement [12]. Population reference values also differ [13]. The research threshold of 6.20 therefore cannot be transferred to other age and ethnic groups without validation.
Central SBP increased alongside office and mean 24-hour blood pressure. This is consistent with the rationale for cross-classifying central and brachial blood pressure [6]. However, strong correlations between haemodynamic measures limit the genuinely new information provided by adding each measure. Expanding the panel alone is not equivalent to a demonstrated improvement in prediction.
The study by C.J. Boos et al. relates arterial stiffness to inflammation and nocturnal blood pressure decline [19]. However, the ambulatory stiffness index used in that study differs from CAVI. Comparison is appropriate at the level of a research hypothesis, not as confirmation of an identical diagnostic threshold or risk magnitude.
Biological interpretation and limitations
Immune profiling in hypertension identifies changes in regulatory and other T-cell populations [20]. Our dataset contains humoral markers but no cellular phenotyping. Increased hsCRP and TNF-α therefore cannot establish a specific T-cell mechanism. The absence of an independent association between operationally defined immune activation and the six-month outcome also does not exclude its involvement in a longer-term vascular process.
CANTOS investigated an anti-inflammatory intervention in patients with previous myocardial infarction and elevated hsCRP [21]. These findings support the biological importance of inflammation, but do not justify anti-cytokine therapy in young military personnel on the basis of the present results. Differences in clinical stage are more important here than similarities in individual markers.
The practical component of the algorithm primarily concerns modifiable factors. Sodium reduction lowered blood pressure in the crossover trial by D.K. Gupta et al. [22]. SSaSS evaluated salt substitution against clinical outcomes, but in a much older, high-risk population [23]. TRIUMPH combined dietary modification, physical activity and weight management in patients with resistant hypertension [24]. These studies provide external support for preventive approaches, not evidence of the effectiveness of this scoring framework.
The analytical limitations require separate consideration. The groups differed in age and BMI; unadjusted comparisons therefore do not isolate the effects of blood pressure. Follow-up assessment was unavailable for 14.2% of the baseline sample, and the relationship between attrition and the endpoint is unknown. The short follow-up and 5-mmHg SBP change threshold increase the importance of monitoring reproducibility [8]. The result should not be interpreted as confirmed onset of sustained hypertension in every participant meeting the endpoint.
Coefficients and original p-values were taken from the dissertation; individual-level data were unavailable for model refitting. The number of markers examined increases the risk of chance findings. The model included seven binary factors and 76 outcomes, but sample size adequacy cannot be determined solely from their numerical ratio [25]. External validation, the calibration slope, an AUC confidence interval and analysis of clinical utility were not reported for the score. These gaps matter when assessing risk of bias [15] and completeness of model reporting [14].
The comparison of the basic and extended algorithms was descriptive. Comparative AUCs, risk reclassification and implementation effects were not evaluated. The next stage should include an independent cohort, prespecified thresholds, standardised monitoring and explicit handling of attrition [7, 14].
Conclusion
In young military personnel, adverse six-month blood pressure change was associated primarily with baseline high-normal blood pressure or hypertension and insufficient nocturnal SBP decline. Inflammatory and stress markers characterised baseline heterogeneity. Operational indicators of immune activation and high stress did not retain independent associations with the outcome. The composite score, with AUC=0.678, identified groups with different outcome frequencies; its use is supported as a research tool for selecting the intensity of follow-up. Its potential to improve clinical outcomes requires prospective evaluation.