
Full text
Introduction
Preventive examination is not limited to detecting established, sustained blood pressure elevation. Hypertension guidelines include assessment of risk factors and out-of-office measurements [1, 2]. Evidence linking blood pressure in young adulthood with later events supports attention to early changes [3]. However, clinical risk must be distinguished from a research-defined combination of subclinical features.
Inflammatory markers and arterial stiffness may provide additional information. The importance of IL-6 and CRP was evaluated in STABILITY [4], and NLR has been studied in large clinical samples [5]. Ferritin may complement the inflammatory–metabolic assessment [6]. How these measures combine with haemodynamics, body weight, sleep and duty-related workload remains an important question in military personnel.
Materials and Methods
The article is based on aggregate results from a single-centre analytical cross-sectional study conducted in 2023–2025, involving 436 young and middle-aged male military personnel. Three groups were defined by the baseline composite profile: group I, relatively favourable, 118 participants; group II, intermediate, 143; and group III, unfavourable combined profile, 175. The description of the design and limitations of interpretation follows STROBE [7].
Classification incorporated haemodynamic, vascular, immunoinflammatory, anthropometric, and duty-related and behavioural domains. According to the protocol, group I included individuals with no adverse features or one feature, group II those with two adverse domains, and group III those with three or more. Group assignment was therefore not independent of the laboratory and vascular measures being compared; between-group differences are interpreted primarily as characteristics of the profiles thus defined.
Office blood pressure was measured with an Omron M6 Comfort device after five minutes of rest. At least two measurements were obtained 1–2 minutes apart; an additional measurement was taken if the difference exceeded 5 mmHg. Such control of measurement conditions is important when interpreting small blood pressure differences [8]. BMI was calculated from weight and height; waist circumference was measured between the lower costal margin and the iliac crest. Anthropometric assessment was not limited to BMI [9].
Oscillometric arteriography was performed using Arteriograph TensioMed after ten minutes of supine rest. PWV, AIx@75 and central SBP were measured. The measurement method was retained in the interpretation because different stiffness indices are not interchangeable [10]. Central blood pressure was considered an additional haemodynamic characteristic [11]. The working PWV >8.0 m/s threshold was used for research classification, not as a universal reference value for all devices.
Ambulatory blood pressure monitoring with BPLab Vasotens was performed in 131 individuals, comprising 27, 42 and 62 participants from groups I–III. Daytime measurements were taken every 15 minutes from 07:00 to 22:00 and night-time measurements every 30 minutes from 22:00 to 07:00. A nocturnal SBP decline of less than 10% was classified as non-dipping. The need to analyse office, 24-hour and nocturnal blood pressure separately follows from ambulatory studies [12, 13].
After 8–12 hours of fasting, CRP was measured by a high-sensitivity immunoturbidimetric assay, IL-6 by ELISA and ferritin by a chemiluminescence assay; a complete blood count was also obtained. NLR was calculated as the ratio of absolute neutrophil to lymphocyte counts. Working thresholds were CRP >3 mg/L, IL-6 >3.5 pg/mL, ferritin >200 ng/mL and NLR >2.5. These cut-offs were retained from the original study; universal diagnostic applicability is not assumed.
The original analysis used ANOVA or the Kruskal–Wallis test, Holm–Bonferroni correction, χ² or Fisher’s exact test, correlations and logistic regression. Reported coefficients and p-values are reproduced here; additional processing was limited to arithmetic calculation of frequencies. Assessment of model reporting took account of TRIPOD+AI [14] and PROBAST [15]. The model was not refitted without individual-level data.
Results
Baseline profile and accumulation of laboratory abnormalities
Mean age increased from 32.7±5.9 years in group I to 37.9±6.0 years in group III. BMI, waist circumference and haemodynamic measures also increased. The difference between the extreme groups was 3.1 m/s for PWV and 20.4 mmHg for central SBP. Baseline grouping itself incorporated several of the features being compared.
| Parameter | Baseline composite profile, M±SD | ||
|---|---|---|---|
| Measure | Group I n=118 |
Group II n=143 |
Group III n=175 |
| Anthropometry and service history | |||
| Age, years | 32.7±5.9 | 35.5±6.3 | 37.9±6.0 |
| Length of service, years | 10.5±5.8 | 13.5±6.6 | 15.9±6.2 |
| BMI, kg/m² | 23.7±1.8 | 26.3±1.9 | 29.2±2.1 |
| Waist circumference, cm | 87.6±4.4 | 91.1±5.1 | 94.6±4.4 |
| Office and central haemodynamics | |||
| Office SBP, mmHg | 114.8±8.5 | 123.4±9.1 | 134.1±9.6 |
| Office DBP, mmHg | 75.3±7.2 | 79.3±6.9 | 82.6±7.5 |
| PWV, m/s | 6.6±1.2 | 7.7±1.2 | 9.7±1.4 |
| AIx@75, % | 10.6±9.8 | 18.4±10.8 | 26.2±10.0 |
| Central SBP, mmHg | 106.9±8.8 | 116.0±9.7 | 127.3±10.8 |
For PWV, AIx@75 and central SBP, the original Table 3.2.1 reports p<0.001. No p-values were added for the other rows of this summary table because they were not provided in the corresponding source tables.
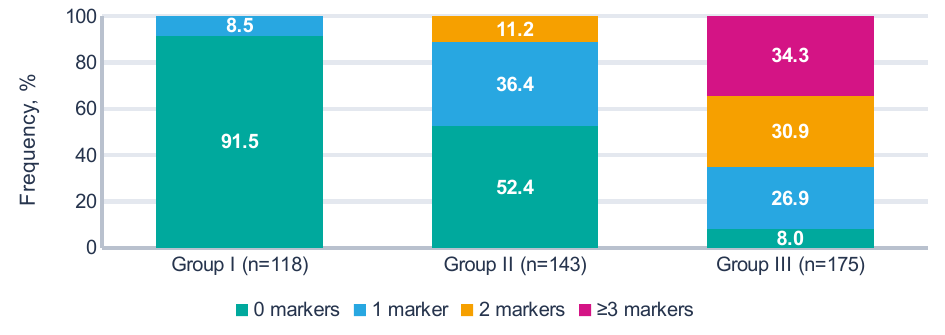
The panel comprises CRP, IL-6, ferritin and NLR. Frequencies were calculated from Table 3.1.3 of the original study. Colours indicate the number of elevated markers, not established disease stages.
No participant in group I had two or more elevated markers. This pattern was recorded in 16 of 143 participants in group II (11.2%) and 114 of 175 in group III (65.1%, calculated from absolute counts). All four measures remained below the elevated range in 108, 75 and 14 military personnel, respectively.
Laboratory profile and its associations with vascular measures
The largest median difference between the extreme groups was observed for CRP, 3.62 versus 1.25 mg/L. IL-6 differed by 2.03 pg/mL, ferritin by 72.0 ng/mL and NLR by 0.83. The overall between-group comparison was significant for all four markers (p<0.001).
| Marker | Median and interquartile range | Three groups | ||
|---|---|---|---|---|
| Measure | Group I n=118 |
Group II n=143 |
Group III n=175 |
p |
| CRP, mg/L | 1.25 [0.81; 1.63] | 2.02 [1.53; 2.72] | 3.62 [2.41; 5.02] | <0.001 |
| IL-6, pg/mL | 1.68 [1.32; 2.08] | 2.40 [1.77; 2.96] | 3.71 [2.76; 4.80] | <0.001 |
| Ferritin, ng/mL | 114.3 [91.8; 134.7] | 150.4 [119.7; 185.0] | 186.3 [159.8; 214.1] | <0.001 |
| NLR | 1.63 [1.34; 1.88] | 2.04 [1.64; 2.32] | 2.46 [2.16; 2.79] | <0.001 |
Values are presented as Me [Q1; Q3], not M±SD. Data are reproduced from Table 3.1.1 of the dissertation; p refers to the overall between-group comparison.
| Operational criterion | I, n=118 | II, n=143 | III, n=175 | Test | |||
|---|---|---|---|---|---|---|---|
| Marker / threshold | n | % | n | % | n | % | p |
| CRP >3 mg/L | 2 | 1.7 | 29 | 20.3 | 111 | 63.4 | <0.001 |
| IL-6 >3.5 pg/mL | 4 | 3.4 | 19 | 13.3 | 98 | 56.0 | <0.001 |
| Ferritin >200 ng/mL | 2 | 1.7 | 16 | 11.2 | 65 | 37.1 | <0.001 |
| NLR >2.5 | 2 | 1.7 | 20 | 14.0 | 80 | 45.7 | <0.001 |
Absolute counts and percentages are presented separately. Working thresholds belong to the research protocol. The p-values were taken from Table 3.1.2 of the original study.
The strongest associations with PWV were observed for CRP (r=0.460) and IL-6 (r=0.447). The coefficients were 0.373 for ferritin and 0.386 for NLR; all had p<0.001. Correlations with office SBP were somewhat weaker, at 0.410, 0.402, 0.337 and 0.354, respectively. These values were obtained from the numerical correlation table, not from the colour map in the original dissertation.
The strongest laboratory correlations concerned BMI. The coefficient reached 0.634 for CRP, 0.585 for IL-6, 0.569 for NLR and 0.538 for ferritin (all p<0.001). This limits interpretation of the inflammatory–vascular association in isolation. Without further adjustment, the marker-specific association with PWV cannot be separated from the shared association with body weight and other features.
Median CRP in smokers was 3.18 [1.86; 4.83] mg/L, compared with 2.00 [1.34; 3.10] mg/L in non-smokers. With good, satisfactory and poor sleep, it was 1.73, 2.33 and 3.63 mg/L. In the moderate, high and very high duty-related workload categories, median CRP was 1.59, 2.23 and 3.33 mg/L. These comparisons describe associations, not the effect of changing the duty schedule.
Twenty-four-hour haemodynamics and multiple elevated markers
In the ambulatory monitoring subgroup, mean 24-hour SBP was 110.9±9.7, 123.0±10.7 and 133.0±10.4 mmHg in groups I–III. The difference in nocturnal SBP between the extreme groups reached 25.3 mmHg. Insufficient nocturnal decline was recorded in 8 of 27, 30 of 42 and 60 of 62 participants.
| Monitoring measure | ABPM subgroup, total n=131 | Three groups | ||
|---|---|---|---|---|
| Measure | Group I n=27 |
Group II n=42 |
Group III n=62 |
p |
| Mean 24-h SBP, mmHg | 110.9±9.7 | 123.0±10.7 | 133.0±10.4 | <0.001 |
| Mean 24-h DBP, mmHg | 71.4±7.7 | 77.7±7.9 | 80.4±8.1 | <0.001 |
| Daytime SBP, mmHg | 115.0±9.3 | 126.4±10.4 | 135.6±10.4 | <0.001 |
| Nocturnal SBP, mmHg | 102.5±10.9 | 116.3±11.7 | 127.8±10.8 | <0.001 |
| Non-dipper, n (%) | 8 (29.6) | 30 (71.4) | 60 (96.8) | <0.001 |
Continuous measures are presented as M±SD. Non-dipping frequencies were calculated only for those who underwent ABPM, not for all 436 participants. Non-dipping was defined as a nocturnal SBP decline <10%.
A separate comparison by the number of elevated markers covered the entire sample. There were 197 participants with no elevated markers, 109 with one, 70 with two and 60 with three or more. Mean PWV increased consistently, without a reversal between adjacent categories.
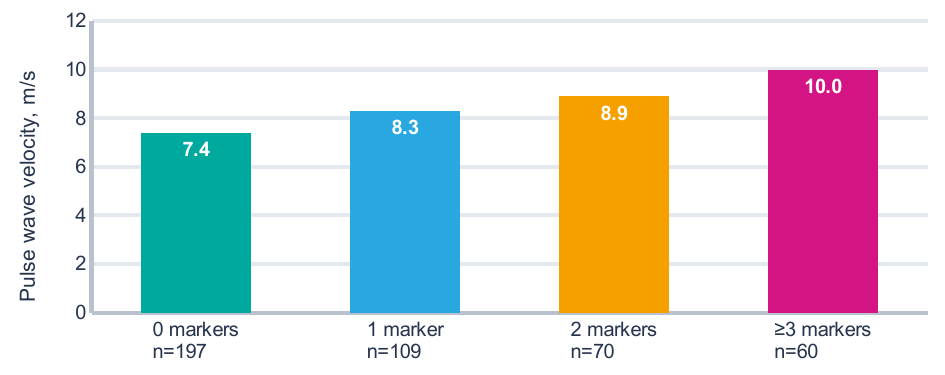
Bars indicate means (M); error bars indicate SD, not confidence intervals. PWV values were taken from Table 3.3.5; category sizes were calculated from Table 3.1.3. Overall between-group p<0.001.
PWV differed by 2.6 m/s between the category with no elevated markers and the category with ≥3 markers. Office SBP was 120.4±10.9 and 135.2±11.3 mmHg, respectively, and AIx@75 was 15.8±11.5 and 27.6±9.1%. Multiple laboratory abnormalities were therefore accompanied by differences in several vascular and haemodynamic characteristics. The cross-sectional design, however, does not establish whether inflammation preceded these differences.
The 96.8% frequency of non-dipping applies to the 62 examined participants in group III. It cannot automatically be extended to all 175 military personnel in that group. Selection for detailed assessment and fixed clock-time definitions of the night period may have influenced the observed frequency.
Multivariable model and score-based classification
The six features presented in Table 5 were retained in the original multivariable analysis. The largest odds ratios concerned PWV >8 m/s and BMI ≥27 kg/m². Confidence intervals remained wide. The OR describes an association with a research-defined subclinical risk category, not an increase in the absolute probability of a clinical event.
| Working criterion | Multivariable analysis | Score 0–12 | |||
|---|---|---|---|---|---|
| Feature | β | OR | 95% CI | p | Points |
| PWV >8.0 m/s | 2.993 | 19.96 | 8.15–48.88 | <0.001 | 3 |
| BMI ≥27 kg/m² | 2.810 | 16.61 | 7.40–37.28 | <0.001 | 3 |
| IL-6 >3.5 pg/mL | 2.402 | 11.04 | 4.20–29.07 | <0.001 | 2 |
| CRP >3.0 mg/L | 2.175 | 8.80 | 3.72–20.81 | <0.001 | 2 |
| Poor sleep quality | 1.768 | 5.86 | 2.22–15.42 | <0.001 | 1 |
| Current smoking | 1.650 | 5.21 | 2.02–13.42 | <0.001 | 1 |
Coefficients, ORs, 95% CIs and p-values are reproduced from Table 4.1.1; points are taken from Table 4.2.1 of the dissertation. The intercept and individual predictions were not reported; no probability calculator was constructed from this table.
For a threshold of ≥5 points, the original study reported AUC=0.970 in the training sample and 0.948 in the test sample. Sensitivity was 95.9% and 88.7%, and specificity was 88.0% and 76.9%, respectively. The specificity difference was 11.1 percentage points. This is more important than the formal retention of a high AUC because it concerns positive results among individuals outside the target category.
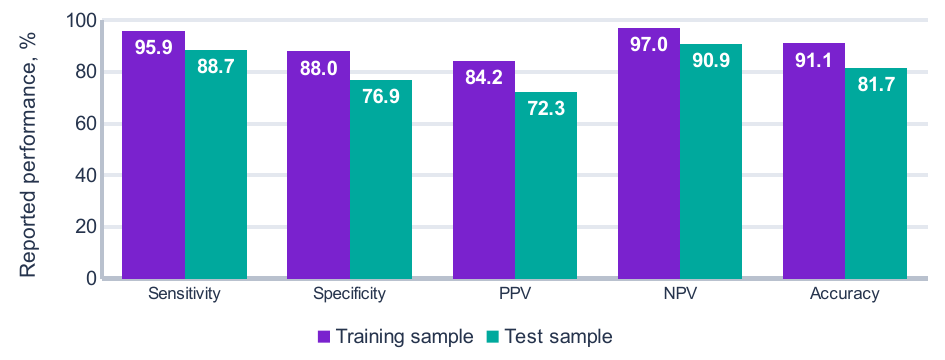
PPV and NPV, positive and negative predictive values. Data are reproduced from Table 4.2.3 of the original study. Subsample sizes, confusion matrices and confidence intervals were not provided there.
The total score had a maximum of 12 points. A threshold of ≥5 was used for binary discrimination, whereas 0–3, 4–6 and ≥7 points defined three follow-up categories. These are different applications of the same score; a result of 5–6 points therefore cannot simultaneously be labelled negative under the binary criterion and high under the three-tier system.
The reported AUCs were not recalculated. Constructing new ROC curves from only two area values would be unjustified. Because the predictors partly overlapped with the baseline profile criteria, the high discrimination estimates are treated as preliminary classification results requiring independent validation.
Discussion
The most informative finding concerns the combination of several laboratory abnormalities with vascular measures, rather than isolated exceedance of a single threshold. With ≥3 elevated markers, mean PWV reached 10.0 m/s, compared with 7.4 m/s when no markers were elevated. CRP and IL-6 correlated more strongly with PWV than ferritin and NLR did. At the same time, all four measures were associated with BMI. The inflammatory profile therefore cannot be considered outside its anthropometric context.
STABILITY investigated inflammatory biomarkers in patients with stable coronary heart disease [4]. An analysis of three randomised trials in statin-treated patients also linked inflammation with residual risk [16]. Agreement in the direction of associations supports interest in CRP and IL-6, but does not make the military sample clinically equivalent to those populations. Post-treatment residual risk and long-term atherosclerotic events were not investigated here.
Evidence for NLR includes an analysis of five large trials [5]. Its accessibility makes it an attractive addition to the complete blood count. However, in our sample, the NLR–PWV correlation was weaker than the CRP–PWV correlation, and NLR was not retained in the final model. These results justify neither dismissing the index as useless nor considering it an independent replacement for vascular assessment.
A. Sciacqua et al. examined the association between ferritin and arterial stiffness in relation to impaired glucose tolerance [6]. In the present dataset, ferritin correlated more strongly with BMI than with PWV. The working threshold >200 ng/mL should not be interpreted as a stand-alone diagnosis of disordered iron metabolism. That question requires a different diagnostic panel and a separate clinical assessment.
Immune mechanisms in hypertension are not limited to humoral markers. M.R. Alexander et al. described changes in circulating T-cell populations [17]. CANTOS tested a targeted anti-inflammatory intervention in established atherosclerotic disease [18]. Neither cellular phenotyping nor anti-cytokine therapy was evaluated in our dataset. These studies therefore provide biological context but do not confirm a specific mechanism or treatment indication in the examined military personnel.
The association of arterial stiffness with subsequent blood pressure elevation in young adults is supported by the prospective study of T. Koivistoinen et al. [19]. Here, PWV and blood pressure were recorded at the same time. A cross-sectional difference of 3.1 m/s between baseline groups does not measure the rate of vascular ageing. Comparison with other studies requires consideration of the oscillometric method and device characteristics [10].
Comparison of central and brachial blood pressure can refine the haemodynamic profile [11]. Nocturnal blood pressure provides separate information [12]. In JAMP, nocturnal phenotypes were associated with prognosis [13], while C.J. Boos et al. jointly examined the ambulatory stiffness index, inflammation and dipping [20]. Our results are consistent with a multidimensional assessment, but do not justify combining different stiffness indices mechanically under a single diagnostic threshold.
Higher median CRP with poor sleep and intensive duties is consistent with experiments on circadian misalignment [21] and studies of shift workers [22]. However, a sleep-quality questionnaire does not replace an instrumental sleep study. The lack of information on the independent contribution of night shifts limits quantitative attribution of the observed changes to service conditions.
Model applicability and study limitations
The principal limitation of the classification analysis is the dependence of the target category on its own predictors. Laboratory measures, arterial stiffness and anthropometry were used to define the baseline composite profile. Subsequent discrimination of that profile using a similar set of features may overestimate diagnostic performance. This incorporation of the index feature into the outcome definition is important in model assessment using PROBAST [15].
The original material simultaneously uses baseline groups, subclinical risk categories and score-based follow-up categories. The exact binary outcome definition across all modelling stages and the relationship between these classifications are insufficiently described. Training and test sample sizes, the splitting procedure, the intercept, AUC confidence intervals and full confusion matrices were not reported. The methods state that 1000 bootstrap repetitions and calibration assessment were performed, but numerical calibration results are absent. Independent verification of model performance against TRIPOD+AI requirements is therefore not possible [14].
A total of 436 observations does not by itself guarantee the stability of a multiparameter model. The frequency of the target category, the number of candidate parameters and estimation optimism must be considered [23]. High ORs and wide intervals, especially for PWV, require evaluation in a new sample. Future work should prespecify an independent outcome that does not contain the predictors themselves and separately evaluate discrimination, calibration and benefit for decision-making [14, 15].
Age and anthropometric differences between groups are relevant to the comparative analysis. The CRP–PWV and IL-6–PWV correlations were not adjusted here for age or BMI. Laboratory cut-offs, single measurements and the absence of individual-level data limit assessment of reproducibility. Ambulatory monitoring was performed in only 30.0% of the full sample, and selection was not described as random. Non-dipping frequencies cannot be treated as prevalence estimates for the entire examined military population [7].
Practical application of these findings involves sequential examination. Anthropometry and questionnaires identify reasons for detailed assessment; laboratory and vascular investigations clarify the combination of abnormalities. BMI should not fully replace assessment of abdominal body mass distribution [9]. All six score components must be measured before calculation; missing IL-6 or PWV values cannot automatically be treated as normal. Diagnostic and treatment decisions should be based on clinical examination and accepted guidelines, not solely on a point total [1, 2].
Sodium control and structured lifestyle modification have their own evidence base [24, 25]. The present study did not test their effectiveness or compare preventive strategies. Nor has it established whether use of the proposed score reduces clinical complications. This requires a separate prospective phase with prespecified outcomes.
Conclusion
In military personnel, multiple elevated CRP, IL-6, ferritin and NLR values were associated with higher PWV, higher central and 24-hour blood pressure, and less favourable anthropometry. These associations support joint assessment of inflammatory and vascular profiles. The scoring model, with a reported test AUC of 0.948, remains a research classification tool. Until independently validated, it cannot be considered a confirmed system for predicting future cardiovascular events.