
Full text
Introduction
Rehabilitation aims to restore functioning and participation in daily life, not merely to reduce individual symptoms [1]. For military personnel, these goals include tolerating occupational demands and resuming full duties. Walking distance, pain severity and the date of clearance for duty should therefore be considered distinct, complementary outcomes.
Current chronic pain recommendations combine education, physical exercise and psychological interventions according to patient needs [2]. Both multicomponent care for low back pain [3] and cognitive behavioural therapy for insomnia [4] have been studied in military personnel. These studies support assessment of several recovery domains, but do not establish the effectiveness of every programme combining similar components.
Heart rate variability measures provide additional information. However, RMSSD depends on recording conditions and breathing; an increase alone does not imply restored occupational readiness [5]. The practical question is whether functional changes persist after the programme and are accompanied by fewer duty restrictions. This article aims to assess these outcomes and examine how baseline risk differences affect comparisons between programmes.
Materials and Methods
Design, participants and follow-up
Summary tables from the dissertation study “Medico-social rehabilitation and health promotion in military personnel: development of a comprehensive programme and criteria for evaluating its effectiveness” were analysed. The primary study was a prospective controlled comparative observational investigation with consecutive recruitment. Randomisation was not described. Reporting of the observational design follows STROBE principles [6].
The total sample included 520 military personnel. G1 received comprehensive personalised rehabilitation (n=205), and G2 standard rehabilitation (n=165). G3 comprised at-risk individuals receiving an extended prevention programme (n=90), and G4 those receiving standard prevention (n=60). The main comparison was G1 versus G2. Prevention participants were not pooled with rehabilitation participants when analysing clearance for duty.
Eligibility included recovery after injuries or diseases, or risk of reduced functional work capacity; participation required consent. Exclusions were acute infection, decompensated chronic disease, unstable cardiovascular conditions, inability to perform the tests, severe mental disorders and incomplete key baseline data. Measurements were obtained before the programme (T0), after eight weeks (T1) and six months after completion (T2). Work disability was compared over two six-month periods: before enrolment and after the programme.
The main programme included adaptation (weeks 1–2), intensive correction (weeks 3–6) and consolidation (weeks 7–8), followed by a maintenance phase. Exercise dose and rules for programme adjustment were described with reference to TIDieR [7].
Intervention content and assessment methods
| Parameter | G1 — comprehensive programme | G2 — standard practice |
|---|---|---|
| Core sessions | 5 times/week, 45–60 min; plus 2 self-directed sessions of 20–30 min | General therapeutic exercise 3 times/week, 30–40 min |
| Exercise content | Aerobic and submaximal resistance exercise, mobility, coordination and post-exercise recovery | General therapeutic exercises; physiotherapy and medication as indicated |
| Individual modules | Management of pain, autonomic regulation, sleep, nutrition and occupational performance according to identified deficits | Additional physician-directed treatment without a fixed modular framework |
| Interim review | Weeks 2, 4 and 8; adjustment of intervention intensity if response is insufficient | No formal algorithm for interim intensification |
| After programme | Individual self-directed exercise plan and risk-based monitoring for 6 months | General advice on exercise and recovery schedule |
Note. Content was reconstructed from section 4.4 of the original study. The programmes differed simultaneously in composition, exercise dose and intensity of contact with professionals.
In the prevention comparison, the extended pathway included three supervised 40–50-minute sessions per week and additional modules; standard prevention involved health-promoting exercises twice weekly for 25–30 minutes and general recommendations. These differences were considered in the descriptive assessment of G3 and G4.
Submaximal exercise tolerance was assessed by the six-minute walk test (6MWT) in a 30-m corridor after rest, with heart rate and oxygen saturation recorded. The original protocol followed ATS recommendations; standardised instructions and test conditions are essential for comparison across time points [8]. The ERS/ATS technical standard also emphasises sensitivity to test procedures and the effect of repeated performance [9].
Pain was recorded using the NRS (0–10), limitations associated with low back pain using the ODI (0–100) [10], sleep quality using the PSQI [11], and quality of life using the PCS and MCS components of the SF-36 [12]. Perceived stress was assessed with the PSS-10 used in the original study; the scale concerns subjective appraisal of stress burden, not diagnosis of a mental disorder [13].
RMSSD was derived from a five-minute recording of RR intervals at supine rest, processed in Kubios HRV [14]; recording conditions were identical at each assessment [5]. High-sensitivity C-reactive protein was measured by immunoturbidimetry, interleukin-6 by enzyme-linked immunosorbent assay and cortisol by electrochemiluminescence analysis of morning serum.
Endpoints and statistical analysis
The main medico-social outcome of this analysis was delayed return to duty, defined as clearance for unrestricted duty more than 28 calendar days after completion of the main programme. Time was not counted from injury or treatment initiation. Additional assessments included time to clearance as a continuous measure, the number of episodes and days of temporary work disability (TWD), repeat healthcare visits and changes in functional measures.
Means and standard deviations (M±SD) were taken from summary tables without reconstructing individual observations. Change was defined as Δ=M(T2)−M(T0), and the difference in changes as ΔG1−ΔG2. These quantities are descriptive: variances of paired changes and covariances of repeated measurements were not reported, so CIs and p-values for differences in changes were not calculated.
Relative risk (RR), ORs and 95% CIs on the logarithmic scale were calculated from absolute frequencies. Pearson’s χ² test and an additional Mantel–Haenszel OR stratified by four baseline risk categories were used [15]. Published category assignments and counts were retained without reclassifying individual participants. An aggregate Welch calculation was applied to the difference in mean times to clearance. Tests were two-sided; additional comparisons were exploratory, without multiplicity correction. Reported predictive model characteristics belong to the original analysis and do not constitute new validation [16].
Results
Baseline characteristics
| Measure | G1 n=205 |
G2 n=165 |
G3 n=90 |
G4 n=60 |
|---|---|---|---|---|
| Age, years | 30.3±6.2 | 30.6±6.4 | 34.1±6.2 | 30.7±7.5 |
| BMI, kg/m² | 25.3±3.1 | 24.8±3.1 | 26.4±3.4 | 25.7±3.4 |
| 6MWT, m | 564.1±61.2 | 554.5±66.5 | 542.4±64.0 | 519.5±66.3 |
| RMSSD, ms | 30.2±10.4 | 30.1±10.5 | 28.5±10.2 | 24.6±11.1 |
| PSQI, points | 6.5±2.9 | 6.3±2.9 | 7.3±3.0 | 7.2±2.8 |
| NRS, points | 5.1±1.7 | 5.2±1.7 | 6.1±2.0 | 5.4±1.7 |
| ODI, 0–100 | 26.0±12.1 | 26.4±12.1 | 32.7±10.8 | 29.2±11.9 |
| SF-36 PCS, points | 44.9±9.2 | 46.3±9.0 | 40.9±8.9 | 42.0±9.7 |
Note. Counts correspond to baseline groups. Prevention groups consisted of at-risk individuals, not healthy controls. 6MWT values retain the precision of the original longitudinal results table.
Mean age, RMSSD and pain measures were similar in G1 and G2, but baseline risk-category composition differed (χ²=11.33; p=0.010). Very high risk was present in 19.5% of G1 and 31.5% of G2; low risk in 30.2% and 18.8%, respectively. Unadjusted frequency comparisons therefore did not describe programme differences independently of baseline status.
Functional changes and maintenance of outcomes
| Measure | G1 — comprehensive rehabilitation | G2 — standard rehabilitation | ||||
|---|---|---|---|---|---|---|
| T0 | T1 | T2 | T0 | T1 | T2 | |
| 6MWT, m | 564.1±61.2 | 617.8±65.6 | 618.4±68.5 | 554.5±66.5 | 582.9±72.8 | 574.0±75.3 |
| RMSSD, ms | 30.2±10.4 | 37.2±12.1 | 36.5±13.0 | 30.1±10.5 | 34.6±12.8 | 34.5±13.5 |
| PSQI, points | 6.5±2.9 | 4.2±3.0 | 4.4±3.3 | 6.3±2.9 | 4.9±3.3 | 5.2±3.6 |
| NRS, points | 5.1±1.7 | 3.2±2.0 | 3.4±2.3 | 5.2±1.7 | 3.9±2.1 | 4.2±2.3 |
| ODI, 0–100 | 26.0±12.1 | 17.1±12.8 | 18.6±14.4 | 26.4±12.1 | 19.9±14.1 | 21.5±14.9 |
| SF-36 PCS | 44.9±9.2 | 52.3±10.1 | 52.4±11.4 | 46.3±9.0 | 49.7±10.2 | 49.2±11.6 |
| SF-36 MCS | 46.6±8.8 | 53.7±10.0 | 53.8±11.2 | 46.6±9.3 | 49.8±11.2 | 49.0±12.2 |
| CRP, mg/L | 1.5±0.9 | 1.2±0.8 | 1.2±0.8 | 1.4±0.8 | 1.3±0.8 | 1.4±1.0 |
| IL-6, pg/mL | 2.6±1.6 | 2.1±1.4 | 2.1±1.5 | 2.7±1.3 | 2.6±1.6 | 2.8±1.9 |
Note. T0, before the programme; T1, after 8 weeks; T2, 6 months after completion. CRP and IL-6 retain the rounding of the original longitudinal table. Group sizes at enrolment were 205 and 165; visit-specific denominators were not reported in the summary tables.
In G1, the post-programme increase in 6MWT was 53.7 m and was maintained at six months (+54.3 m). In G2, corresponding changes were +28.4 and +19.5 m. The difference in changes between G1 and G2 increased from 25.3 m after the programme to 34.8 m at follow-up. In the prevention groups, gains at T2 were 35.0 and 16.1 m. Absolute results and trajectories for all four groups are presented in Figure 1.
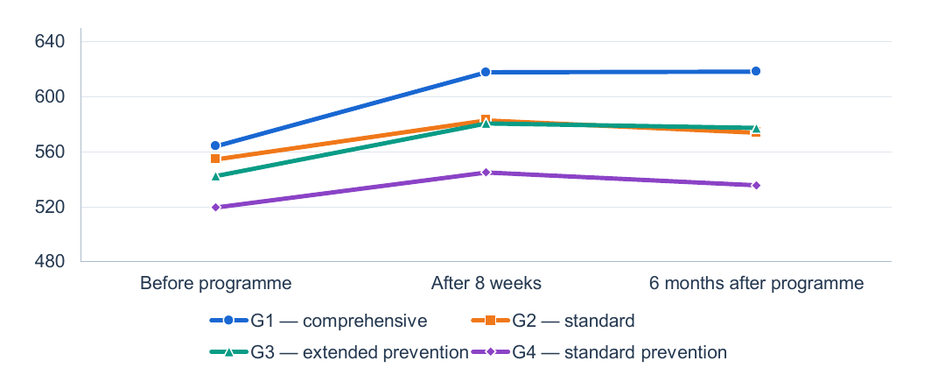
Note. The time axis is categorical: intervals between visits are unequal. Lines connect group means, not individual trajectories; M±SD values for the main comparison are provided in Table 3.
Quality of life and medico-social outcomes
Pain reduction did not fully coincide with changes in limitations. By T2, NRS decreased by 1.7 points in G1 and 1.0 in G2; ODI decreased by 7.4 and 4.9 points, respectively. Differences in changes were −0.7 and −2.5 points. SF-36 physical component scores increased by 7.5 and 2.9 points, and mental component scores by 7.2 and 2.4. Figure 2 compares gains across the four groups; it does not imply identical baseline severity or direct interchangeability of pathways.
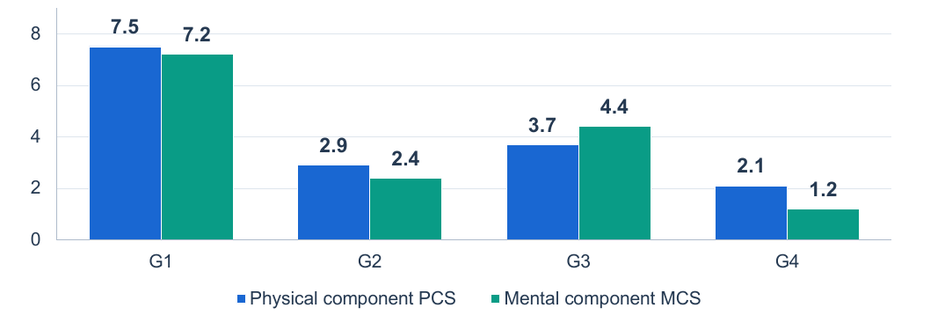
Note. Differences in group mean PCS and MCS scores are presented. These are neither percentages of treatment responders nor standardised effect sizes. G1/G2, rehabilitation; G3/G4, prevention.
| Group | Number of episodes | Number of days | Δ days | ||
|---|---|---|---|---|---|
| Before enrolment | After programme | Before enrolment | After programme | ||
| G1, n=205 | 1.7±1.1 | 0.5±0.7 | 15.9±7.7 | 5.1±4.2 | −10.8 |
| G2, n=165 | 1.8±1.4 | 0.9±0.9 | 16.5±8.3 | 7.8±5.3 | −8.7 |
| G3, n=90 | 2.2±1.6 | 0.9±0.8 | 21.9±7.6 | 8.4±4.8 | −13.5 |
| G4, n=60 | 2.4±1.5 | 1.4±1.1 | 21.7±9.7 | 12.1±6.9 | −9.6 |
Note. Δ is the difference between post-programme and pre-enrolment means. CIs for changes were not reconstructed because the variance of paired differences was unavailable.
TWD days decreased by 67.9% in G1 and 52.7% in G2 relative to the baseline mean. The difference in changes was −2.1 days; the difference in post-programme period means was −2.7 days. The larger absolute reduction in TWD in G3 should be considered in the context of its higher baseline level, not as evidence that prevention was superior to rehabilitation.
Mean time to clearance for unrestricted duty was 26.6±14.4 days in G1 and 31.6±14.0 in G2. The difference was −5.0 days (aggregate 95% CI −7.9 to −2.1; p<0.001). Repeat healthcare visit frequencies were 17.1%, 19.4%, 27.8% and 30.0%, respectively. In the original four-group comparison, p=0.057; a statistically convincing reduction in repeat visits was not established.
Delayed return to duty accounting for baseline risk
Delayed recovery was recorded in 72 of 370 observations (19.5%). Its frequency was 13.7% in G1 and 26.7% in G2; the absolute difference was −13.0 percentage points. RR was 0.51 (95% CI 0.33–0.79), and the unadjusted OR was 0.44 (95% CI 0.26–0.74; χ²=9.87; p=0.002).
| Baseline risk | G1 — comprehensive | G2 — standard | OR G1/G2 (95% CI) |
||||
|---|---|---|---|---|---|---|---|
| N | n | % | N | n | % | ||
| Very high | 40 | 13 | 32.5 | 52 | 26 | 50.0 | 0.48 (0.20–1.13) |
| High | 48 | 8 | 16.7 | 45 | 13 | 28.9 | 0.49 (0.18–1.33) |
| Moderate | 55 | 5 | 9.1 | 37 | 4 | 10.8 | 0.83 (0.21–3.30) |
| Low | 62 | 2 | 3.2 | 31 | 1 | 3.2 | 1.00 (0.09–11.47) |
| Total | 205 | 28 | 13.7 | 165 | 44 | 26.7 | 0.44 (0.26–0.74) |
Note. N is the number of participants in a category; n is the number cleared for duty more than 28 days after the programme. The existing categorisation from Table 4.3.6 of the original study was used. ORs and CIs were additionally calculated from absolute frequencies; within-category estimates are imprecise because of few events.
After stratification, the pooled Mantel–Haenszel OR was 0.55 (95% CI 0.31–0.97; χ²=4.18; p=0.041). The shift from 0.44 to 0.55 indicates attenuation after accounting for risk category (Figure 3). Frequencies were identical in the low-risk category, so a programme advantage within every individual category is not supported. The stratified estimate remains exploratory and does not replace multivariable adjustment using individual-level data.
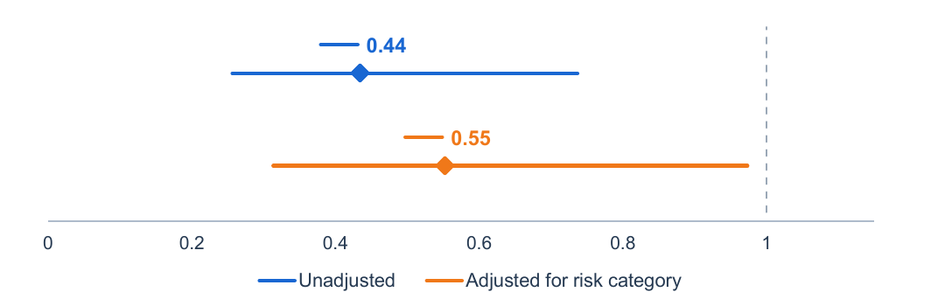
Note. Diamonds represent ORs; horizontal error bars indicate 95% CIs; the dashed line denotes OR=1. Values below 1 indicate lower outcome odds in G1. Stratification used four risk categories developed in the same research dataset.
The original seven-predictor model included age, 6MWT, ODI, RMSSD, PSQI, CRP and ECG abnormalities. Reported values were AUC=0.84 (95% CI 0.79–0.89) and AUC=0.82 after bootstrap correction. These characteristics describe internal model discrimination. Individual predictions and the ROC curve were not reproduced in this analysis.
Discussion
The main study finding concerns the sustainability of functional recovery. In the comprehensive group, gains in walking distance persisted after completion of the programme, whereas standard management was followed by loss of part of the gain. Time to clearance for duty was also shorter. These are nevertheless different endpoints: the 6MWT characterises submaximal exercise tolerance and does not replace assessment of specific occupational tasks. Reference values and thresholds for clinically important change from respiratory populations cannot automatically be transferred to military personnel [8, 9].
In the study by Goertz et al. involving 750 military personnel, adding multicomponent chiropractic care to usual treatment was associated with reduced pain and disability [3]. In RESTORE, individualised cognitive functional therapy reduced activity limitations in chronic low back pain, with the benefit maintained over one year [17]. These findings are consistent with the direction of the present results, but do not establish equivalence of the interventions: diagnoses, treatment components, doses and disability scales differed.
The psychological component also requires specific assessment. Cherkin et al. reported advantages of stress reduction training and cognitive behavioural therapy over usual care for chronic low back pain [18]. However, the mean NRS reduction of 1.7 points and ODI reduction of 7.4 points in the present dataset cannot be converted into a claim of clinically meaningful response in every participant. IMMPACT recommendations and consensus guidance on interpreting change distinguish individual response from the mean between-group effect [19, 20].
The 2.1-point reduction in PSQI in G1 at follow-up was accompanied by a 6.3-ms increase in RMSSD and lower mean CRP and IL-6. The trial by Taylor et al. in 100 military personnel supports targeted treatment of insomnia [4]; however, sleep hygiene and brief self-regulation sessions in the programme under study are not equivalent to a full course of cognitive behavioural therapy. Irwin et al. found effects of behavioural interventions on inflammatory measures in older adults with insomnia [21], but extension of this mechanism to military personnel remains hypothetical. Concurrent changes in sleep, RMSSD and CRP do not establish a mediating role for any of them [5].
Evaluation of long-term outcomes is particularly important. In the 2026 analysis by Shannon et al., involving 144 military personnel from a subsample of the same trial as the Goertz study, the pain difference was virtually absent at 52 weeks; the disability estimate was small and its CI included zero, whereas the difference in sleep disturbance persisted [22]. This was a continuation of the original trial, not an independent replication. It illustrates why immediate post-programme improvement should not be equated with sustained superiority across all measures.
In the present analysis, accounting for baseline risk reduced the magnitude of the association between the programme and delayed recovery. Exercise dose and professional contact were also greater in G1. The result therefore applies to the entire care package, not to an isolated effect of the index or personalisation algorithm. Separating these components requires comparison of programmes at comparable doses and recording of actual adherence [7].
Limitations and implications for further research
Interpretation is limited by observational allocation to programmes, a mixed clinical population and secondary analysis of summary data alone. Participants with different injuries and diseases cannot be treated as a homogeneous diagnostic group; in particular, the ODI was originally designed for disability associated with low back pain [10]. Available tables do not provide counts at each follow-up visit, reasons for attrition or the distribution of adverse events. Consequently, no deterioration in selected laboratory means is not evidence of safety, and absence of reported missing data does not imply complete follow-up [6].
Risk categories were developed from the same material in which outcomes were evaluated, limiting the independence of the stratified assessment. Review of the original manuscript also identified discrepant weighted means of the composite index and ambiguous assignment of the boundary value of 55 points to adjacent categories. Only the consistent absolute frequencies in the existing category table were therefore used; neither the index formula nor its cut-offs are proposed for stand-alone clinical use without checking the primary database. These issues concern predictor applicability and risk of model bias [23].
Seven final predictors and 72 events give approximately 10.3 events per parameter, but this figure does not account for the full extent of preliminary selection. Sample size adequacy is not determined by this ratio alone [24]. The reported bootstrap correction does not replace independent assessment in another population [16]. Implementation requires a full account of development, calibration, handling of missing data and external validation in accordance with current requirements for regression-based prediction models [25]. AUC does not answer whether model use improves clinical decisions; clinical utility must also be assessed, including by decision curve analysis [26].
The most justified next step is a confirmatory comparison with a prespecified primary endpoint, uniform rules for clearance for unrestricted duty and comparable therapeutic contact. Individual repeated measurements and information on branch of service, baseline severity, adherence and additional treatment are needed. This design would distinguish sustained functional change from effects of selection, follow-up frequency and administrative clearance procedures [6, 7].
Conclusion
In the rehabilitation subsample studied, the comprehensive programme was associated with maintenance of the increase in six-minute walk distance at six months (+54.3 versus +19.5 m), reduced temporary work disability and a 5.0-day shorter mean time to clearance for unrestricted duty. Delayed recovery was recorded in 13.7% and 26.7% of participants; after accounting for baseline risk category, the OR was 0.55 (95% CI 0.31–0.97).
The results support further evaluation of comprehensive management with simultaneous assessment of exercise, pain, sleep and participation in duty activities. They do not establish independent effectiveness of the adaptive reserve index, programme superiority within every risk category or a reduction in repeat healthcare visits. Practical application of the predictive component requires verification of primary data and independent validation.
Ethical information. This article is based on aggregate results without participant identifiers. Details of ethical approval for the primary study, funding and conflicts of interest were not available in the supplied manuscript and require confirmation by the author.