
Full text
Introduction
Urinary tract infections (UTIs) are among the most common bacterial infections. Recurrent disease develops in 20-30% of patients after the first episode and accounts for a large proportion of repeat consultations and antibiotic prescriptions [1-3]. Increasing resistance among uropathogens, including the spread of extended-spectrum beta-lactamase (ESBL)-producing and multidrug-resistant (MDR) strains, reduces the predictability of empirical therapy, and each repeated course creates further selection pressure [4-6]. Military personnel constitute a distinct population: shift duties, field exercises, restricted fluid intake and irregular voiding, deployments, and cold exposure may facilitate repeated contamination and persistence of the pathogen.
Current guidelines on recurrent UTIs prioritise non-antibiotic prevention and microbiological confirmation of episodes [7-9]. However, they do not adequately formalise the role of anatomical and functional lower urinary tract factors, including post-void residual urine, reduced urinary flow, and impaired coordination of voiding, which may maintain a functional niche for bacterial persistence irrespective of the susceptibility profile. Microbiological and functional domains have not previously been integrated into a single stratification model for a military cohort.
Study objective was to identify clinical, microbiological, and anatomical and functional determinants of frequent UTI recurrence in military personnel and to develop a practical risk-stratification score for differentiated prevention.
Materials and Methods
A clinical observational study was conducted in a cohort of military personnel in the Republic of Uzbekistan. Of 180 individuals initially assessed, 132 were included in the final analysis; 48 were excluded because they did not meet the inclusion criteria, had incomplete data, declined urine culture, or had substantial comorbidity. The inclusion criteria were age 18-45 years, active-duty military status, and a verified clinical UTI phenotype. Recurrent UTI was defined as at least two episodes within 6 months or at least three episodes within 12 months; frequent recurrence was defined as at least five episodes within 12 months.
Four groups were formed: group 1 comprised patients with recurrent UTI and clinically significant anatomical and functional lower urinary tract abnormalities (n=42; 31.8%); group 2 comprised patients with recurrent UTI without such abnormalities (n=47; 35.6%); group 3 comprised patients with a single UTI episode (n=25; 18.9%); and group 4 comprised apparently healthy participants with no history of UTI (n=18; 13.6%). Mean ages were 37.12±5.21, 30.64±5.95, 27.76±5.05, and 28.39±5.20 years, respectively (p<0.001); women predominated in groups 1-3 (70.2-72.0%). The groups were comparable by service branch (p=0.753), rank category (p=0.428), smoking, shift duties, and deployments. Group 1 had a longer duration of military service (median 10.0 vs 6.0-7.0 years; p<0.001), a higher body mass index (28.20±3.82 kg/m2; p=0.002), and a higher prevalence of previous catheterisation (23.8%; p=0.002).
Clinical assessment included a structured history documenting the number of episodes over 6 and 12 months, dysuria and pain on a 0-10 visual analogue scale, urgency on a 0-5 scale, quality of life on a 0-100 scale, the Acute Cystitis Symptom Score in women [16], and 3-day voiding diaries completed according to International Continence Society standards. Quantitative midstream urine culture was performed before antibacterial therapy using CLED agar, blood agar, MacConkey agar, and chromogenic medium. Organisms were identified and antimicrobial susceptibility was tested with the BD Phoenix 50 system, with confirmation by disc diffusion and Etest; results were interpreted according to EUCAST criteria [10]. ESBL production was detected by the combined-disc test. Multidrug resistance was defined as non-susceptibility to at least one agent in three or more antimicrobial categories [11]. Failure of empirical therapy was defined as persistent symptoms after 48-72 hours, a clinically indicated change of antimicrobial agent, or recurrent significant bacteriuria after treatment.
Post-void residual urine volume was measured ultrasonographically with the Mindray DC-70 Pro within 10 minutes after voiding using the ellipsoid formula. Uroflowmetry was performed with the ORUFLOW V2 at a voided volume of at least 150 mL, with recording of maximum urinary flow rate (Qmax) and curve type (normal, moderately obstructive, obstructive, plateau, or intermittent) [12]. Bladder outlet obstruction, neurogenic dysfunction, and detrusor-sphincter dyssynergia were verified from clinical and functional findings and, when indicated, by comprehensive urodynamic testing with the Laborie system.
Statistical analyses were performed in IBM SPSS Statistics 26.0. Data are presented as median [Q1; Q3], mean ± standard deviation, and n (%). The Kruskal-Wallis test, Mann-Whitney U test with Bonferroni correction, chi-square test, Fisher's exact test, Spearman correlation, and univariable and multivariable logistic regression with assessment of multicollinearity by the variance inflation factor were used. Receiver operating characteristic analysis used cut-offs based on the Youden index; calibration was assessed with the Hosmer-Lemeshow test; and internal validation used 1,000 bootstrap replications and 5-fold cross-validation [13, 14]. The point score was derived by linear scaling of the regression coefficients. Differences were considered statistically significant at p<0.05.
Results
The median number of episodes over 12 months was 5 [4; 6] in group 1, 4 [3; 5] in group 2, 1 [1; 1] in group 3, and 0 in the control group (p<0.001). At least five episodes occurred in 78.6% and 48.9% of patients in groups 1 and 2, and at least seven episodes occurred in 21.4% and 4.3%, respectively, whereas the 6-month medians in groups 1 and 2 were identical at 3 [2; 4]. Among 89 patients with recurrent disease, recurrence associated with lower urinary tract dysfunction accounted for 47.2%, the uncomplicated phenotype for 25.8%, and the complicated phenotype without dysfunction for 27.0%; group 2 was therefore internally heterogeneous, with proportions of 48.9% and 51.1%. Urgency was the leading clinical discriminator of group 1: a score of at least 3 occurred in 71.4% versus 27.7%, and the combination of frequency, urgency, and nocturia occurred in 54.8% versus 19.1% and was not recorded in groups 3 or 4. Dysuria severity (p=0.389) and pain severity (p=1.000) did not differ between groups 1 and 2. Quality of life was lower in group 1 (52.16±10.47 vs 60.51±10.78 points; p=0.003), and scores below 55 occurred in 59.5% versus 27.7% (Table 1).
| Characteristic | Group 1 (n=42) |
Group 2 (n=47) |
Group 3 (n=25) |
Group 4 (n=18) |
p |
|---|---|---|---|---|---|
| UTI episodes over 12 months, median [Q1; Q3] | 5 [4; 6] | 4 [3; 5] | 1 [1; 1] | 0 [0; 0] | <0.001 |
| Urgency score, 0-5 | 3.70 [2.82; 4.25] | 2.10 [1.40; 3.15] | 1.90 [1.10; 2.70] | 0.70 [0.23; 1.10] | <0.001 |
| Quality-of-life score, 0-100 (mean ± SD) | 52.16±10.47 | 60.51±10.78 | 73.19±10.03 | 90.91±4.63 | <0.001 |
| Bacteriuria, log10 CFU/mL | 5.43 [5.09; 5.67] | 5.15 [4.72; 5.60] | 4.89 [4.65; 5.12] | 0.00 | <0.001 |
| Pyuria, cells per high-power field | 39.5 [32.0; 49.0] | 33.0 [23.0; 43.5] | 20.0 [8.0; 32.0] | 2.5 [2.0; 4.0] | <0.001 |
| Post-void residual urine volume, mL | 130.0 [95.5; 160.8] | 33.0 [16.0; 42.5] | 18.0 [11.0; 25.0] | 8.0 [6.3; 12.8] | <0.001 |
| Post-void residual urine >100 mL, n (%) | 30 (71.4) | 0 (0.0) | 0 (0.0) | 0 (0.0) | <0.001 |
| Qmax, mL/s | 11.0 [7.9; 13.2] | 15.8 [14.8; 18.2] | 22.6 [19.6; 25.6] | 24.2 [19.5; 26.5] | <0.001 |
| Qmax <15 mL/s, n (%) | 36 (85.7) | 13 (27.7) | 1 (4.0) | 1 (5.6) | <0.001 |
| Bladder outlet obstruction, n (%) | 24 (57.1) | 8 (17.0) | 1 (4.0) | 0 (0.0) | <0.001 |
| Neurogenic dysfunction, n (%) | 12 (28.6) | 2 (4.3) | 0 (0.0) | 0 (0.0) | <0.001 |
| Previous catheterisation, n (%) | 11 (26.2) | 4 (8.5) | 0 (0.0) | 0 (0.0) | 0.002 |
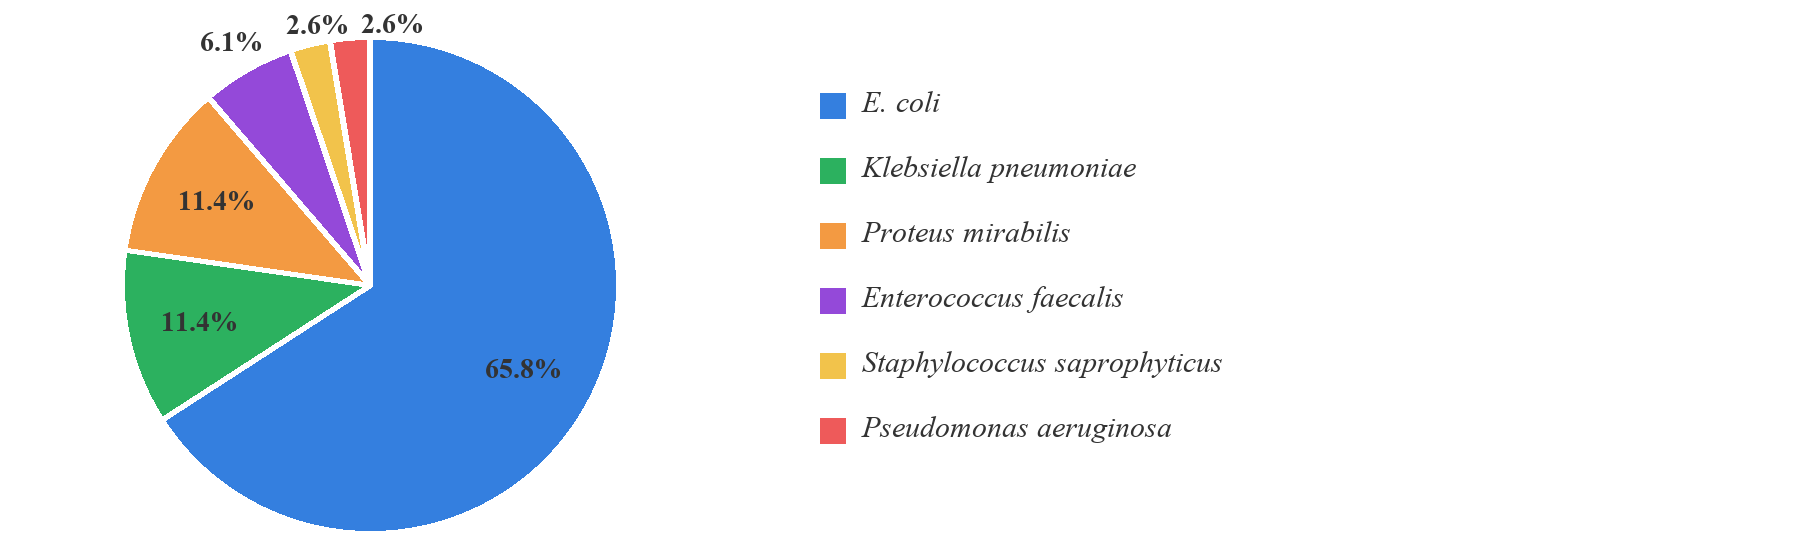
Clinically significant bacteriuria was detected in all 114 patients in groups 1-3. E. coli predominated, accounting for 75 of 114 isolates (65.8%); Klebsiella pneumoniae and Proteus mirabilis were each isolated in 13 patients (11.4%), Enterococcus faecalis in 7 (6.1%), and Staphylococcus saprophyticus and Pseudomonas aeruginosa in 3 each (2.6%) (Figure 1). The proportions of E. coli in the three groups were 69.0%, 59.6%, and 72.0% (p=0.539). However, Gram-positive organisms were more frequent as the principal uropathogen in group 2, at 17.0% compared with 4.8% in group 1 and 0% in group 3 (p=0.026), including E. faecalis in 12.8%. Polymicrobial growth was recorded in 33.3%, 17.0%, and 12.0% of patients in groups 1-3 (p=0.071). A negative nitrite test despite culture-confirmed bacteriuria occurred in 45.2%, 31.9%, and 44.0% of patients. ESBL-producing isolates were identified in 19.0%, 17.0%, and 8.0% of patients (p=0.466), including 20.0% of E. coli isolates.
Antimicrobial susceptibility results are presented in Table 2. Among oral options, fosfomycin (71.4-88.0% susceptible) and nitrofurantoin (61.9-88.0% susceptible; p=0.072 for the trend across groups) retained the most consistent activity. By contrast, susceptibility to amoxicillin/clavulanate in group 1 was only 26.2% (p=0.011), and approximately half of isolates were susceptible to ciprofloxacin and co-trimoxazole. Among parenteral agents, cefuroxime had the lowest activity (40.0-45.2% susceptible), whereas carbapenems (85.7-92.0%) and piperacillin/tazobactam (69.0% in group 1 and 85.1% in group 2) had the greatest activity.
| Antimicrobial agent | Group 1 (n=42) |
Group 2 (n=47) |
Group 3 (n=25) |
p |
|---|---|---|---|---|
| Fosfomycin | 71.4 | 78.7 | 88.0 | – |
| Nitrofurantoin | 61.9 | 68.1 | 88.0 | 0.072 |
| Amoxicillin/clavulanate | 26.2 | 51.1 | 60.0 | 0.011 |
| Ciprofloxacin | 59.5 | 59.6 | 48.0 | – |
| Co-trimoxazole | 54.8 | 61.7 | 48.0 | – |
| Ceftriaxone | 59.5 | 51.1 | 56.0 | – |
| Gentamicin | 61.9 | 70.2 | 84.0 | – |
| Carbapenems | 85.7 | 89.4 | 92.0 | – |
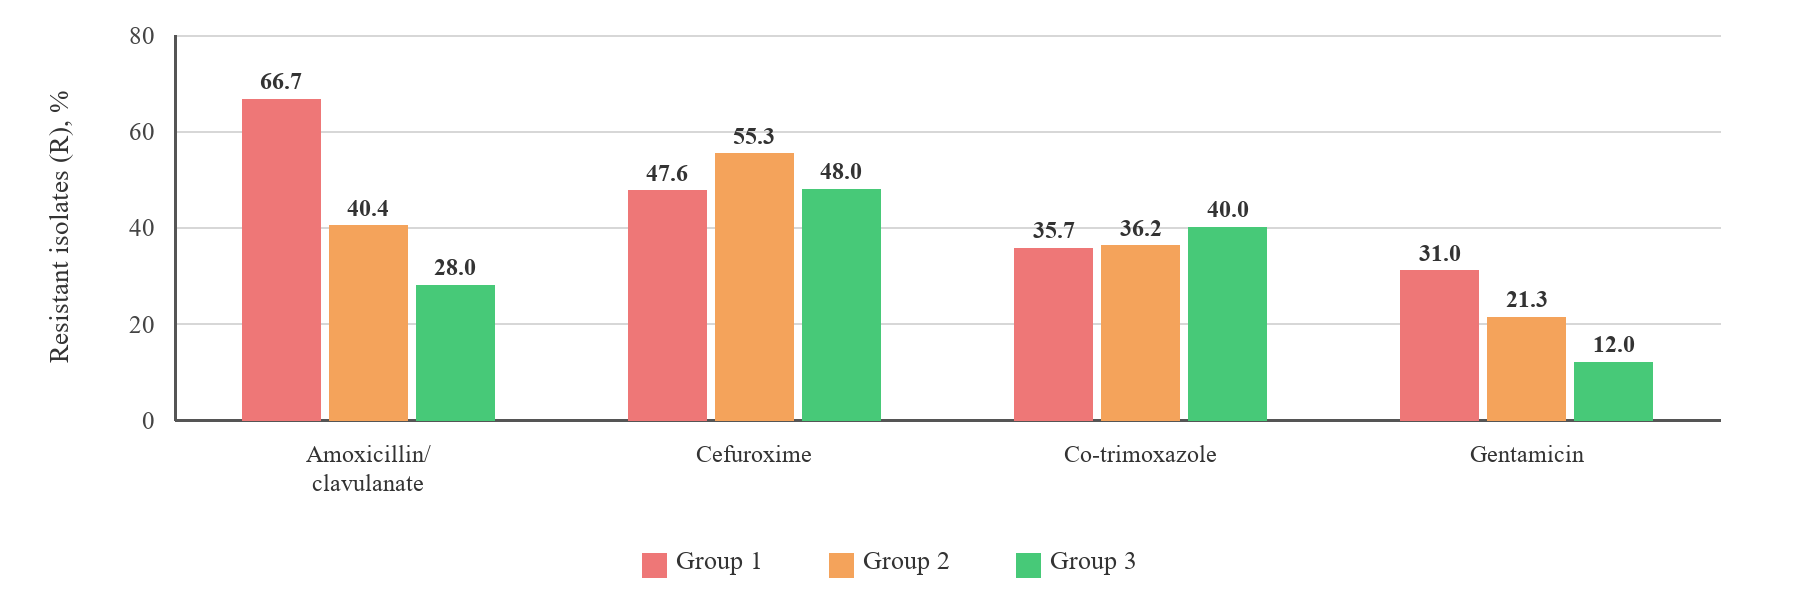
Resistance according to EUCAST category R was most pronounced for amoxicillin/clavulanate in group 1 and for cefuroxime in all groups (Figure 2). Resistance to ciprofloxacin was 34.0-40.0%; resistance to fosfomycin and nitrofurantoin in the recurrent-UTI groups was 17.0-23.8%; and resistance to piperacillin/tazobactam was 23.8% in group 1 compared with 8.5% in group 2. MDR isolates accounted for 69.0%, 61.7%, and 56.0% of isolates (p=0.027 for the total number of category R results per patient). Among ESBL-positive Enterobacterales, susceptibility to cefuroxime decreased to 16.7% compared with 53.0% (p=0.008), and susceptibility to amoxicillin/clavulanate decreased to 22.2%, whereas fosfomycin (88.9% susceptible), gentamicin (88.9%), piperacillin/tazobactam (77.8%), and carbapenems (100%) retained activity. Failure of empirical therapy occurred in 35.7%, 29.8%, and 16.0% of patients in groups 1-3 (p=0.224). Culture-guided treatment modification was required in 48.0-54.8% after 4-5 days; treatment failure occurred in 44.4% of ESBL-positive cases compared with 26.0% of ESBL-negative cases.
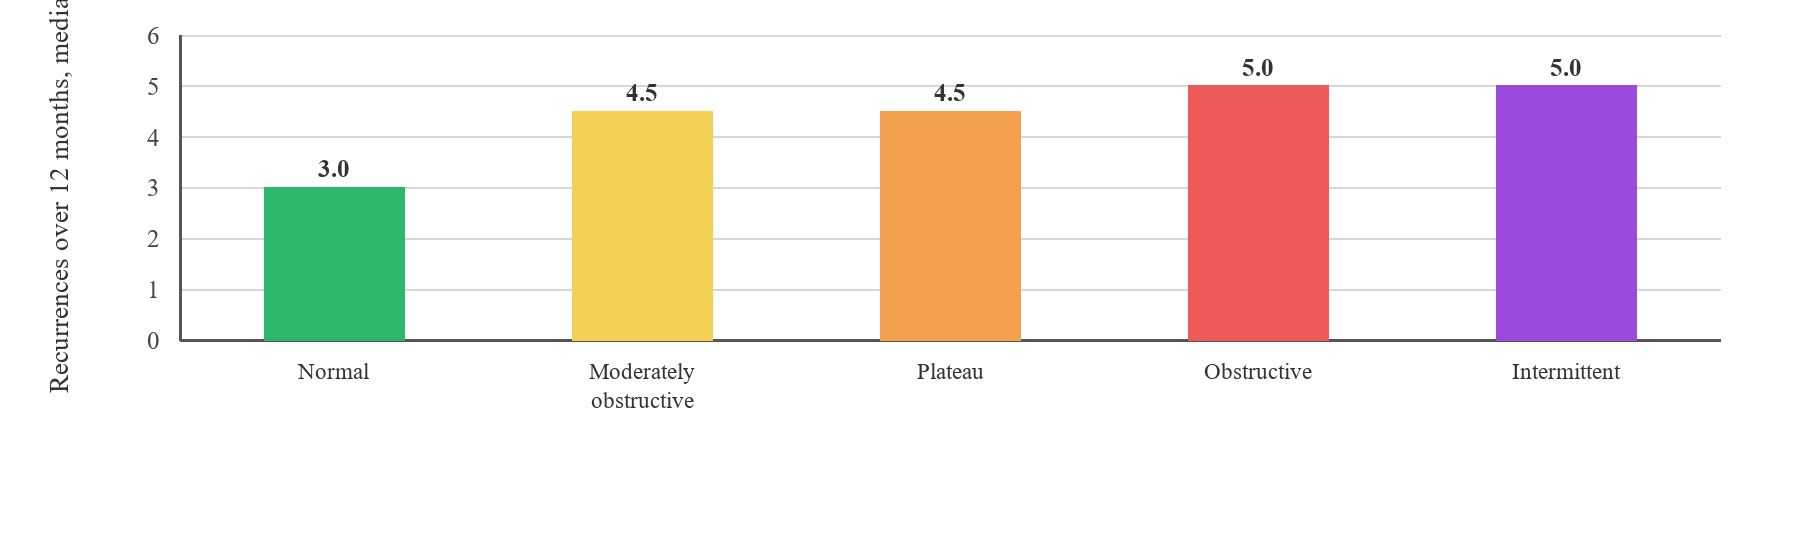
The lower urinary tract functional profile produced the clearest differences (Table 1). In group 1, post-void residual urine volume exceeded 100 mL in 71.4% of patients and Qmax was below 15 mL/s in 85.7%. Normal uroflowmetry curves were absent; the obstructive pattern predominated (50.0%), followed by the plateau pattern (33.3%), while an intermittent pattern occurred in 16.7%. In group 2, despite the inclusion criteria, 34.1% had moderately obstructive (21.3%) or intermittent (12.8%) curves, and post-void residual urine volume exceeded that of the control group (p<0.001). In the combined recurrent-UTI cohort (n=89), the number of recurrences over 12 months varied by uroflowmetry curve type (p=0.004; Figure 3) and Qmax category (p=0.016; Spearman rho=-0.271 for the correlation with recurrence count). Within group 2, the median recurrence counts for normal, moderately obstructive, and intermittent curves were 3.0, 4.5, and 5.0, respectively (p=0.042).
Frequent recurrence, defined as at least five episodes within 12 months, occurred in 66.7% of patients in group 1, 36.2% in group 2, and none in group 3 (p<0.001); in the combined sample of groups 1-3 (n=114), 45 patients (39.5%) had the target outcome. Patients with frequent recurrence had a greater post-void residual urine volume (89.0 vs 33.0 mL; p=0.002), lower Qmax (12.7 vs 17.5 mL/s; p<0.0001), greater urgency, longer disease duration (25.4 vs 13.7 months; p=0.001), more severe dysuria, bacteriuria, and pyuria, and lower quality of life (55.47±10.12 vs 63.31±13.83; p=0.0007). ESBL status (15.6% vs 15.9%), MDR status (64.4% vs 62.3%), service-related factors, smoking, and body mass index were not associated with recurrence frequency. In univariable analysis, the largest odds ratios were observed for post-void residual urine volume above 50 mL (OR 5.54; 95% CI 2.44-12.59), disease duration of at least 12 months (OR 4.69), Qmax below 15 mL/s (OR 4.14), at least three episodes within 6 months (OR 4.04), previous catheterisation (OR 3.66), and an urgency score of at least 4 (OR 3.22). In receiver operating characteristic analysis, Qmax had the greatest discrimination (AUC 0.752; cut-off 16.4 mL/s); post-void residual urine volume had an AUC of 0.673 at a cut-off of 55 mL, with 78.3% specificity.
The extended nine-predictor model had an AUC of 0.822 but a higher, less favourable Akaike information criterion value of 133.2. The final model with four binary predictors had the lowest Akaike information criterion value (126.2) and an AUC of 0.808 (Table 3; variance inflation factor ≤1.20). The logit function was: logit(p) = -2.891 + 1.566 × [post-void residual urine volume >50 mL] + 1.279 × [at least 3 episodes within 6 months] + 0.981 × [dysuria score ≥6] + 0.898 × [disease duration ≥12 months].
| Predictor | beta | OR (95% CI) | p | Points |
|---|---|---|---|---|
| Post-void residual urine >50 mL | 1.566 | 4.79 (1.91-12.01) | 0.0008 | 7 |
| ≥3 episodes within 6 months | 1.279 | 3.59 (1.46-8.87) | 0.0055 | 5 |
| Dysuria score ≥6 | 0.981 | 2.67 (1.07-6.62) | 0.035 | 4 |
| Disease duration ≥12 months | 0.898 | 2.45 (0.84-7.19) | 0.102 | 4 |
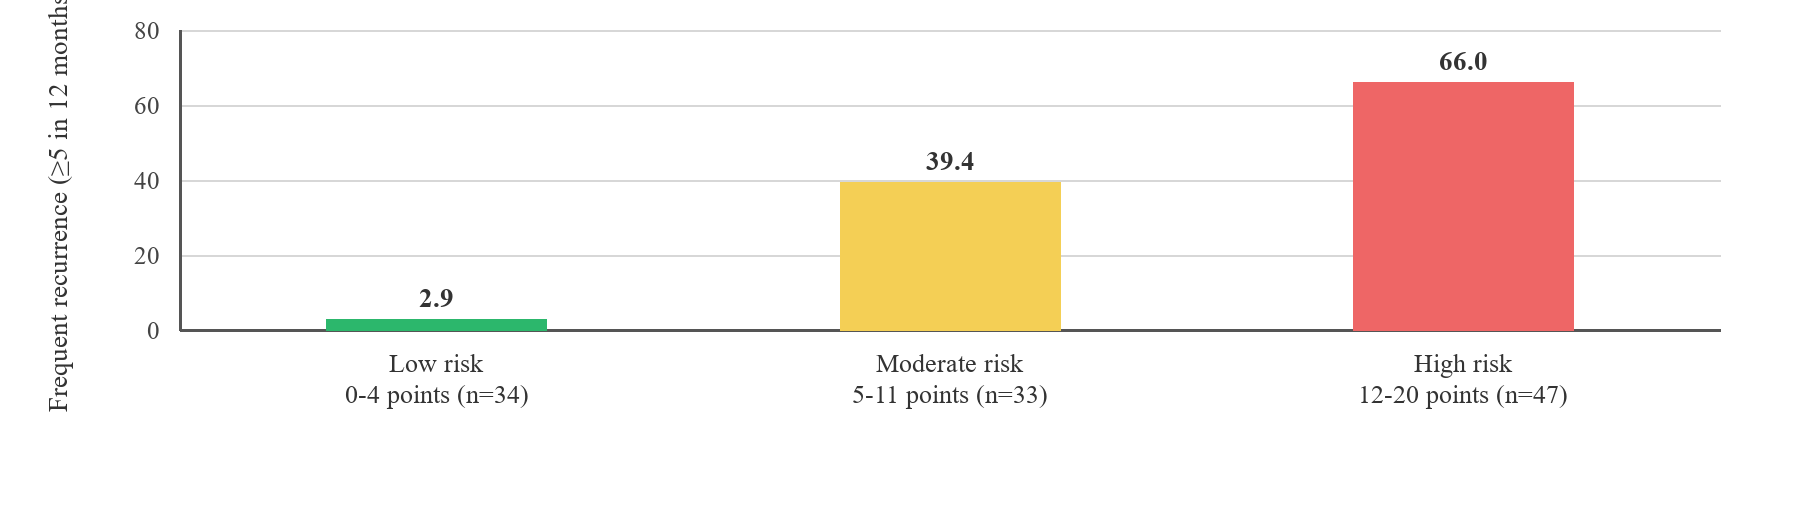
The model had an AUC of 0.808 (bootstrap 95% CI 0.741-0.889; mean AUC in 5-fold cross-validation 0.807), a Brier score of 0.174, and a Hosmer-Lemeshow p value of 0.631. At a predicted-probability threshold of 0.329, sensitivity was 88.9%, specificity was 59.4%, and the negative predictive value was 89.1%. A threshold of 0.25 increased sensitivity to 95.6%, whereas a threshold of 0.50 increased specificity to 76.8%. The point score, with a maximum of 20 points, defined low-risk (0-4 points), moderate-risk (5-11 points), and high-risk (12-20 points) categories with observed frequent-recurrence rates of 2.9%, 39.4%, and 66.0%, respectively (Figure 4). The high-risk category was concentrated in group 1 (34 patients; outcome rate 70.6%), whereas every patient in group 3 was in the low-risk category.
For prevention triage, the point score was supplemented with functional and anatomical red flags: post-void residual urine volume above 100 mL, Qmax below 10 mL/s, an obstructive or plateau uroflowmetry curve, neurogenic dysfunction, detrusor-sphincter dyssynergia, previous catheterisation, or recurrence despite adherence to preventive measures. The presence of any red flag prompted referral to specialist care irrespective of the total score. The four levels of prevention comprised basic measures for 0-4 points; enhanced non-antibiotic measures with mandatory urine culture at recurrence for 5-11 points; combined prevention with the option of supervised antibiotic prophylaxis for 12-20 points; and priority correction of urodynamic abnormalities when red flags were present. Fosfomycin was designated as the preferred agent, nitrofurantoin as an alternative, and carbapenems as reserve agents.
Discussion
The principal finding was that, in this military cohort, UTI recurrence frequency was associated with conditions that permit infection to persist in the lower urinary tract rather than with the species distribution of pathogens or resistance markers. E. coli remained the leading uropathogen across all phenotypes, in agreement with population-based and multicentre studies [1, 4, 5], whereas ESBL production and MDR, despite prevalences of up to 19% and 69%, were not associated with the number of episodes. Resistance therefore influenced the probability that a given course would fail, as shown by the higher rate of failure of empirical therapy in ESBL-positive cases, but it did not explain recurrence without considering the urodynamic background. This distinction is important for prevention: broadening antimicrobial coverage at every recurrence does not eliminate the functional niche and only sustains selection pressure [6, 8].
The susceptibility profile reproduced trends described in regional surveillance programmes [4, 5]: amoxicillin/clavulanate, cefuroxime, fluoroquinolones, and co-trimoxazole had limited reliability as empirical options, whereas fosfomycin and nitrofurantoin retained activity, including against ESBL-producing isolates, consistent with current guidelines [7-9]. Nevertheless, resistance to first-line agents occurred in approximately one in five patients with recurrent UTI, and a negative nitrite test despite culture-confirmed bacteriuria occurred in 32-45% of cases. These findings support routine microbiological confirmation.
The functional domain formed the core of the prognostic model. Post-void residual urine volume above 50 mL was the strongest independent predictor, and uroflowmetry curve type differentiated recurrence frequency even within the group without clinically significant anatomical and functional abnormalities. Experimental and clinical studies have described the role of incomplete bladder emptying and impaired urodynamics in the persistence of intracellular bacterial reservoirs and biofilms [15]. The present data translate this mechanism into measurable thresholds suitable for outpatient assessment. The four-factor model, with an AUC of 0.808, and the point score, with a risk gradient from 2.9% to 66.0%, provide a practical basis for triage, while the red flags reduce the risk of underestimating patients with a moderate score but marked dysfunction.
This study has several limitations, including its single-centre design, small subgroups for individual pathogens, lack of external model validation, and the borderline statistical significance of disease duration in the multivariable model. The score should therefore be evaluated in independent cohorts.
Conclusion
1. Recurrent UTIs in military personnel were heterogeneous. In 47.2% of patients, recurrence occurred in the presence of lower urinary tract dysfunction, while the group without clinically significant abnormalities was divided almost equally between uncomplicated and complicated phenotypes. Urgency was the leading clinical marker of dysfunction.
2. E. coli remained the principal uropathogen (65.8%) in the presence of high rates of MDR (56.0-69.0%) and ESBL production (8.0-19.0%). Fosfomycin and carbapenems retained the greatest activity, whereas amoxicillin/clavulanate, cefuroxime, fluoroquinolones, and co-trimoxazole were unreliable for empirical treatment.
3. Independent predictors of frequent recurrence were post-void residual urine volume above 50 mL, at least three episodes within 6 months, a dysuria score of at least 6, and disease duration of at least 12 months. The model had an AUC of 0.808, and the 0-20 point score identified categories with frequent-recurrence rates of 2.9%, 39.4%, and 66.0%.
4. A stratified algorithm combining the point score, functional red flags, and microbiologically informed antimicrobial selection supports a shift from universal to differentiated prevention and may limit repeated empirical antibiotic treatment in a military cohort.