
Full text
Correspondence: Nurullo Khait ugli Sadullaev, nurullosadullaev.93@gmail.com.
Introduction
The practical value of fundus autofluorescence in Stargardt disease lies in its ability to delineate lesions repeatedly without dye injection. A dark central region can be measured at successive visits, while surrounding flecks and background abnormalities place the lesion within a wider retinal pattern. Longitudinal ProgStar studies established a substantial evidence base for using decreased autofluorescence as a structural outcome in ABCA4-related disease [1,2].
Three questions nevertheless require separate answers. The first concerns the area already occupied by a markedly reduced signal. The second concerns the surrounding retina, where photoreceptor abnormalities may extend beyond that area. The third concerns visual function. A single area measurement cannot resolve all three, even when its repeatability is high. Combined near-infrared FAF, short-wavelength FAF and OCT provide complementary information about these boundaries [3].
Signal intensity is a further source of ambiguity. Quantitative FAF, usually abbreviated qAF, measures calibrated fluorescence rather than the area of an atrophic lesion. Brightness and area therefore describe different properties. An apparent decline in fluorescence is not automatically a favourable change, and an increase is not a direct count of surviving cells. The distinction becomes especially important when serial measurements are interpreted as treatment outcomes [4–6].
This review addresses whether FAF can serve as a marker of atrophic change, rather than a universal marker of disease severity. The objective is to separate established longitudinal measurements from technical uncertainty and from inferences requiring OCT or functional confirmation.
The principal distinction is between a measurable autofluorescence lesion and the full extent of retinal dysfunction. These are related, but they are not identical outcomes.
Materials and methods
Targeted literature retrieval was conducted on 19 September 2026 through web-accessible PubMed, PubMed Central, journal and institutional records; OpenAlex-based discovery was also used. Searches combined ABCA4 or Stargardt disease with fundus autofluorescence, atrophy progression, OCT, repeatability and automated segmentation. Original human studies directly relevant to measurement or interpretation were selected purposively. This was not a registered systematic review.
| Evidence stream | Source and material | Question addressed |
|---|---|---|
| Longitudinal natural history | ProgStar, 259 enrolled participants [1,2] | How quickly does a graded lesion enlarge? |
| Multimodal comparison | Müller et al., 44 patients [3] | Do FAF and outer retinal boundaries coincide? |
| qAF repeatability | Dhooge et al., 102 participants; 166 eyes in repeat testing [4] | How variable is calibrated signal intensity? |
| Segmentation evaluation | Zhao et al., 193 images [5]; Ahmed et al., 316 eyes [6] | How consistent are image-derived lesion measurements? |
Units of analysis differ between studies. The 12- and 24-month ProgStar reports describe overlapping follow-up of the same programme, not independent replication.
Study design, genetic ascertainment, imaging modality, lesion definition, measurement unit and reported uncertainty were extracted. Eye-based results were not converted into patient-based estimates. Repeated reports were not pooled. The figures redraw published aggregate results; confidence intervals and repeatability coefficients retain their original meanings. No missing observations or clinical images were simulated.
Results
Operational definition of an atrophic lesion
DDAF and questionably decreased autofluorescence (QDAF) are image-grading categories. They should remain identifiable in the report rather than being collapsed into an unspecified “atrophy score”. The distinction is particularly relevant at irregular lesion borders, where the visual threshold is less secure [1,5].
| Measurement | Operational meaning | Interpretive boundary |
|---|---|---|
| DDAF area, mm² | Very dark lesion, conventionally at least 90% as dark as the optic disc [5] | A marker of advanced damage, not a direct histological count |
| QDAF area, mm² | Intermediate decrease, conventionally 50% to less than 90% darkness [5] | Borderline abnormal tissue; not equivalent to complete RPE loss |
| Total DAF area, mm² | Combined decreased-signal territory under the stated grading protocol [1,2] | Composition may change as QDAF becomes DDAF |
| qAF, calibrated units | Signal intensity calibrated against an internal reference [4] | Not lesion area and not a direct measure of function |
RPE, retinal pigment epithelium. Thresholds are protocol-dependent operational criteria; image quality and masking still require review.
A plausible increase in the DDAF component can occur without an equal increase in the outer boundary of total DAF. Conversion of intermediate tissue into a darker category changes the composition of the lesion. Therefore, differing DDAF and total DAF growth estimates are not intrinsically contradictory. Their interpretation depends on the baseline category and the exact outcome definition [1,2].
Normal low foveal signal, vessels, shadowing and acquisition artefacts also need separation from a pathological lesion. This is a measurement safeguard: a region should not be classified as atrophic merely because it looks dark on an isolated image.
Longitudinal enlargement and baseline lesion size
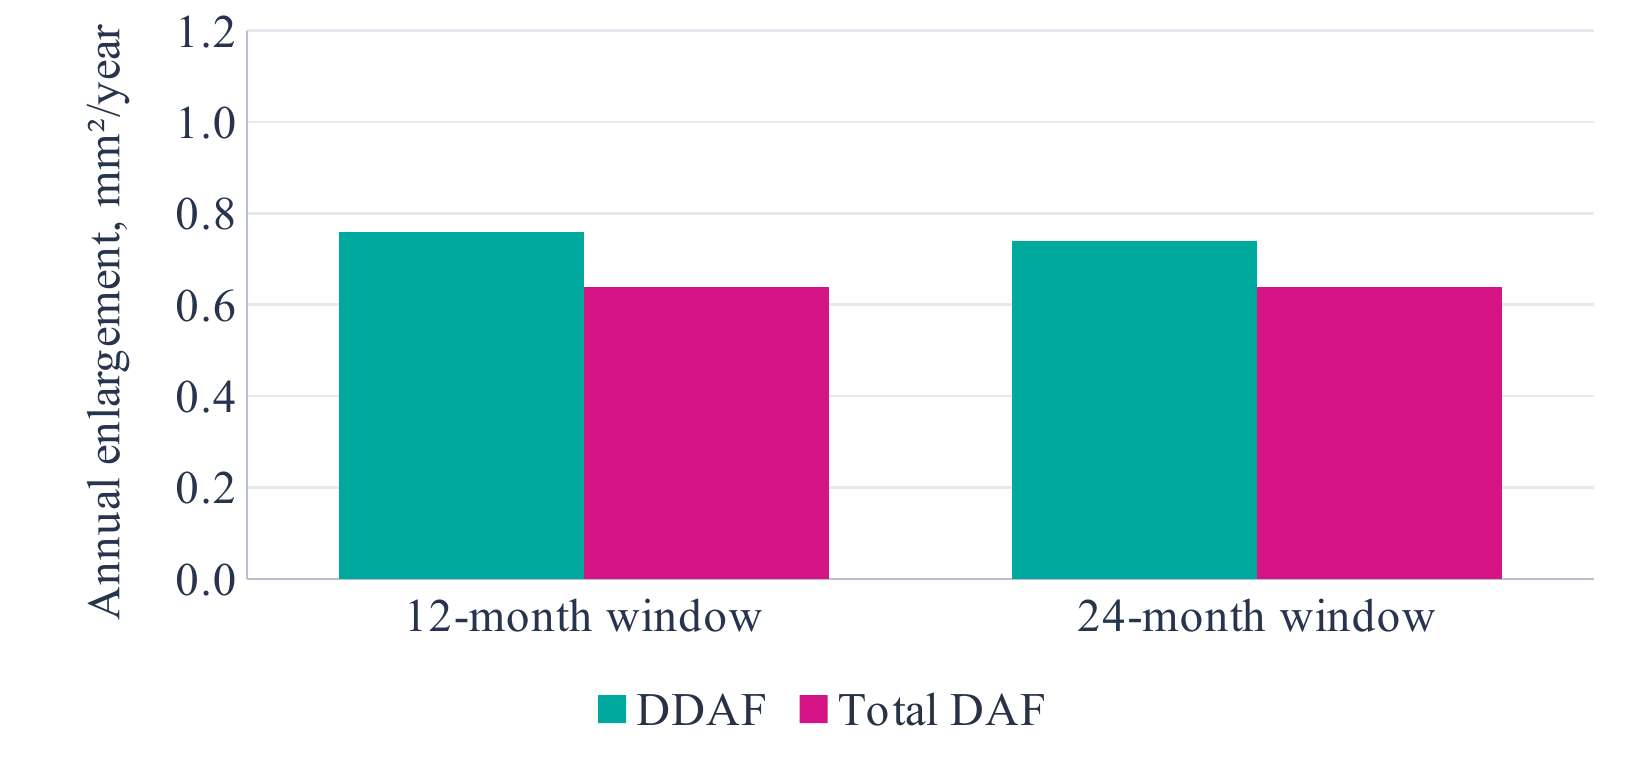
Bars are published estimates; whiskers are 95% confidence intervals. DDAF: 0.76 (0.54–0.97) and 0.74 (0.64–0.85) mm²/year; total DAF: 0.64 (0.50–0.78) and 0.64 (0.57–0.71) mm²/year. Sources [1,2]. These are overlapping cohort analyses, not a between-study treatment comparison.
Both reports detected enlargement during follow-up. The 24-month analysis included 488 eyes at baseline, with 432 reaching the final visit. The annual estimates provide a cohort-level description under the study eligibility and grading conditions. They are not an individual forecast for an eye with a different starting area or lesion configuration [2].
Baseline lesion size influenced progression in ProgStar. A larger area should therefore not be read as evidence of intrinsically faster biological damage without considering starting size. Square-root transformation changes the measurement scale and can reduce size dependence, but transformed millimetres per year must not be mixed with raw square millimetres per year [1,2].
Location adds another dimension. In the topographic analysis by Young et al., lesion-border progression increased with foveal eccentricity, whereas the incidence of existing atrophy was greatest centrally. A global area and a local border velocity answer different questions [8].
Calibrated fluorescence and measurement variability
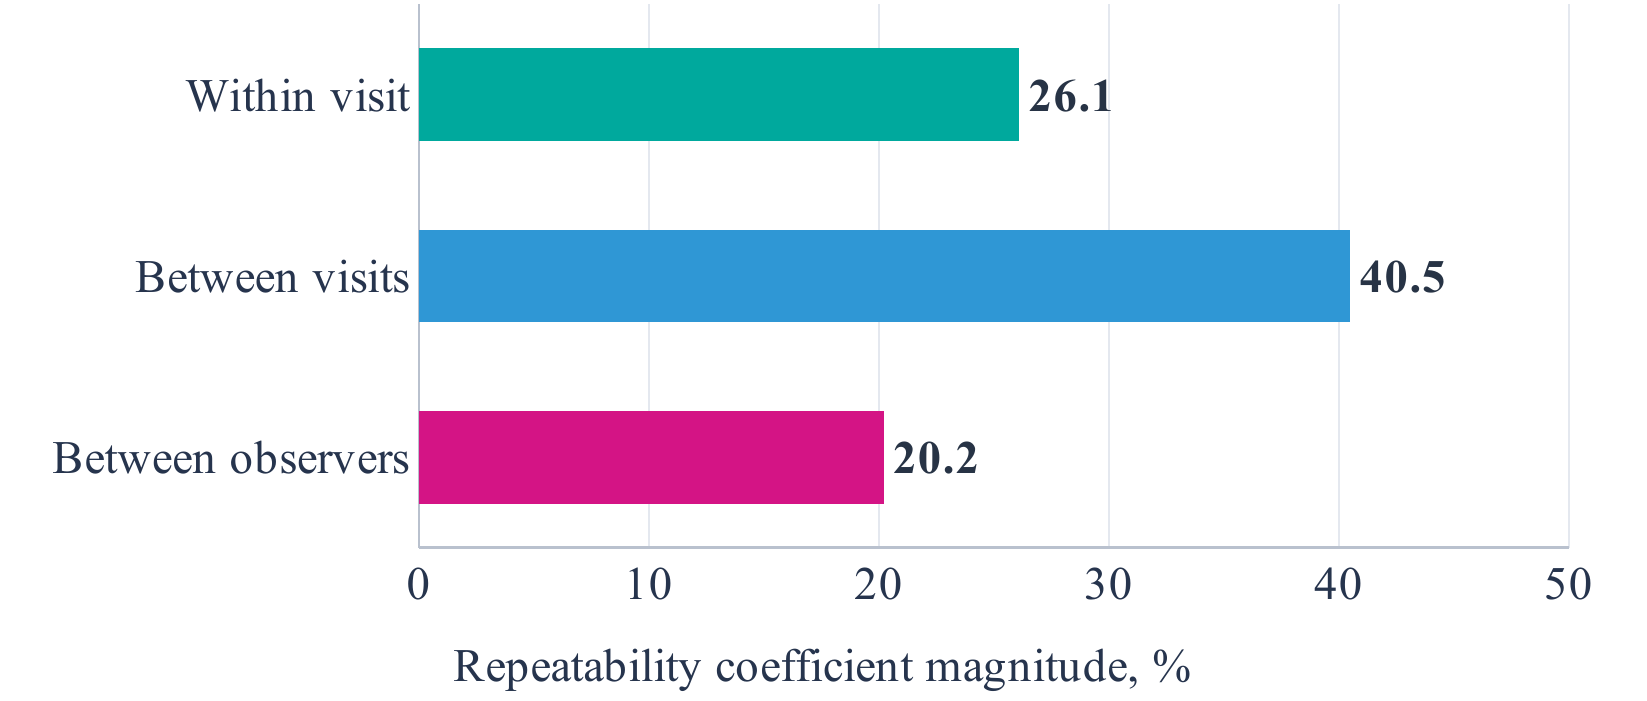
The bars represent the absolute magnitude of the reported ± repeatability coefficients, not percentages of affected eyes. Published values were ±26.1% within visits, ±40.5% between visits and ±20.2% between observers [4].
These results concern calibrated fluorescence, not repeatability of DDAF area. Inter-visit variability was greater than within-visit variability in the STARTT analysis. A small qAF difference in one eye cannot therefore be interpreted solely from its direction. Recording quality, alignment, operator performance and the method used to select repeated acquisitions remain relevant [4].
OCT and near-infrared FAF also change the interpretation of apparently preserved tissue. In the 44-patient multimodal study, abnormal near-infrared territory extended beyond short-wavelength abnormalities, and selected FAF borders correlated closely with outer retinal band loss on OCT [3]. The darkest FAF core was consequently not a complete map of all structural disturbance.
The appropriate comparison is spatially registered and modality-specific. A reproducible lesion boundary, a change in calibrated brightness and a loss of the ellipsoid zone should be recorded as separate observations before their relationship is considered.
Automated delineation and multimodal reporting
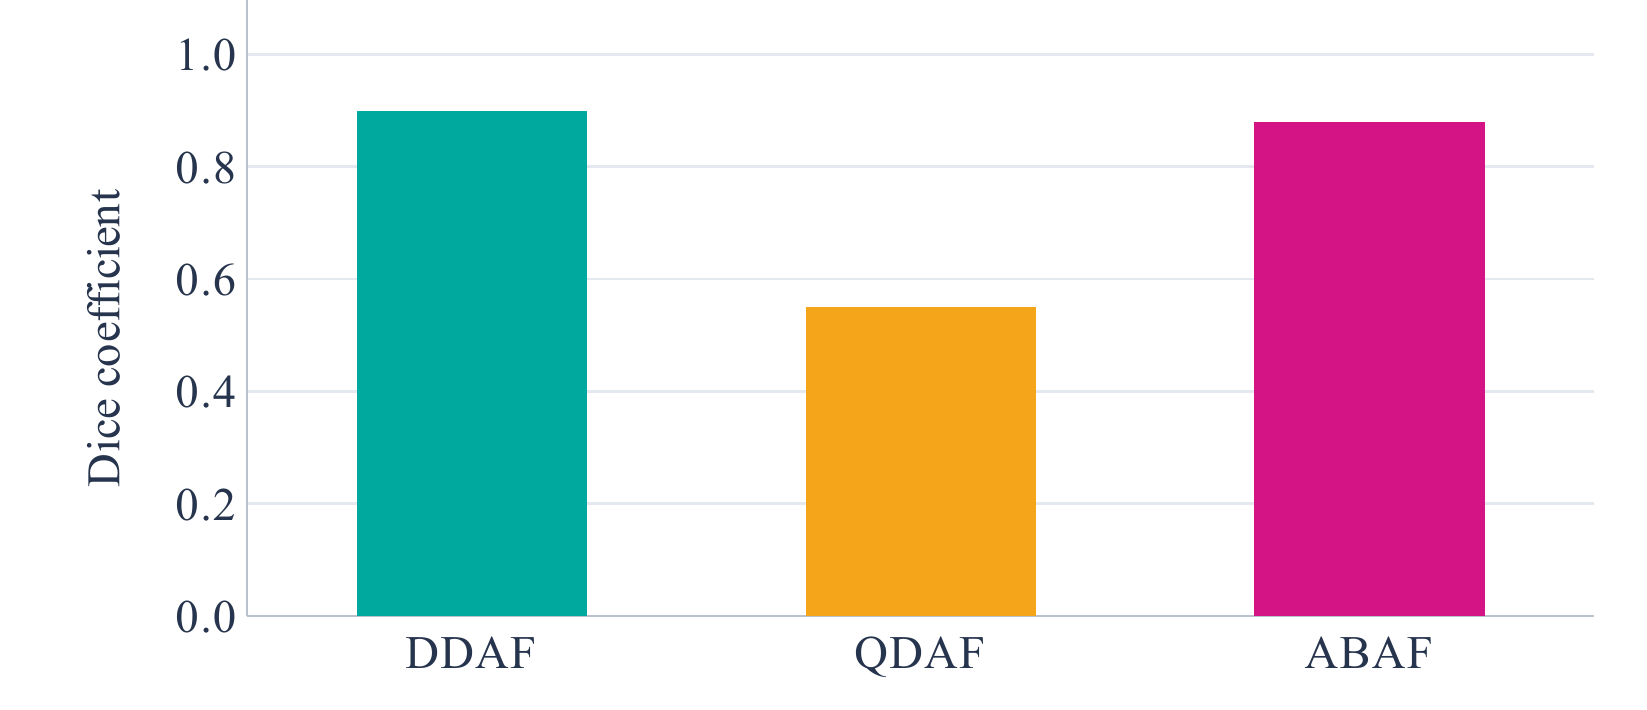
Dice coefficients and 95% confidence intervals were 0.90 (0.85–0.94) for DDAF, 0.55 (0.35–0.76) for QDAF and 0.88 (0.73–1.00) for abnormal background autofluorescence (ABAF). The evaluation used 193 images from 97 patients [5].
Intermediate lesions were less consistently segmented than very dark lesions. This matters when a combined endpoint contains both. A newer threshold-based study reported high reproducibility but also cross-method bias; its central 6-mm analysis region and predominantly Asian paediatric/adolescent trial cohort limit unrestricted transfer to other settings [6].
| Record separately | Reason |
|---|---|
| DDAF, QDAF and total DAF | Keep the measured outcome explicit |
| Foveal involvement and lesion position | Preserve clinically relevant topography |
| OCT structure and functional testing | Do not equate image area with visual function |
A synthesis of the measurement issues in [1–8], not a validated clinical score.
Discussion
The evidence supports FAF as a structural monitoring method, with its strongest role in quantifying clearly defined atrophic lesions over time. This role is narrower than a claim that FAF represents the complete disease process. A sharply measurable abnormality may coexist with less sharply defined photoreceptor damage outside its border. Conversely, a change in a fluorescence category may occur within an already abnormal region [1–3].
For interpretation, the decisive step is to specify what has changed. Enlargement of total decreased autofluorescence suggests expansion of abnormal territory under the selected protocol. Enlargement of DDAF within that territory may instead represent a shift towards a darker lesion class. A fall in qAF concerns signal intensity. Treating these outcomes as synonyms obscures the result rather than simplifying it.
Functional assessment remains necessary. ProgStar microperimetry recorded measurable changes in macular sensitivity over approximately one year, supporting the value of a separate functional endpoint [7]. The reasoning is straightforward: two eyes with similar total lesion area can differ in foveal involvement and in the distribution of residual sensitivity. Their measured area need not imply the same reading ability or fixation behaviour.
Automation can improve consistency, but a highly repeatable algorithm can still follow a definition that does not capture the whole clinical question. Agreement with manual grading establishes agreement with a chosen image standard. It does not by itself establish tissue viability, visual benefit or a validated treatment surrogate. The distinction is particularly important for QDAF, where automated border agreement was less secure [5,6].
For research design, an appropriate hierarchy is therefore a prespecified structural endpoint, explicit acquisition quality criteria and complementary functional outcomes. For clinical interpretation, the same hierarchy becomes a concise description of lesion size, position, OCT structure and change in vision. Neither approach requires every modality to return an identical boundary.
Limitations
This review used focused, non-systematic retrieval and did not apply duplicate independent screening or a formal risk-of-bias instrument. Studies were selected for direct relevance rather than assembled as an exhaustive evidence set. Some numerical information was available only in published abstracts or accessible text; unavailable patient-level data were not reconstructed.
The evidence includes related ProgStar reports, different imaging fields, different lesion definitions and distinct analysis units. Reproducibility studies address technical performance, while natural-history studies address change over time. Their estimates cannot be combined into a single validity statistic. Results from selected trial or referral populations may not describe the full ABCA4 phenotypic spectrum.
Conclusions
FAF is a useful marker of atrophic change in ABCA4-associated Stargardt disease when DDAF, QDAF and total decreased autofluorescence are explicitly distinguished. Serial area measurements require comparable acquisition, a stable grading protocol and attention to baseline lesion size and topography. Calibrated signal intensity should remain a separate outcome.
The most informative assessment combines FAF-defined lesion extent with OCT-defined outer retinal damage and an independent measure of visual function. Image agreement and reproducibility strengthen measurement, but do not alone establish clinical benefit or biological specificity.
Declarations
This manuscript reports a secondary synthesis of published evidence and contains no newly recruited participants or individual-level clinical dataset. No new ethics approval or trial registration is claimed.