
Full text
Correspondence: Feruza Alisherovna Ikramova, centr-med@gmail.com.
Introduction
Irritable bowel syndrome (IBS) is a disorder of gut–brain interaction defined by recurrent abdominal pain associated with altered bowel habit [1, 2]. A multinational survey by the Rome Foundation found Rome IV IBS in about 4% of adults who responded online [3]. The disorder impairs quality of life and work capacity, and its management remains challenging [4].
Military service combines chronic psychological stress, irregular sleep and meals and exposure to infectious gastroenteritis. In a large cohort of US active-duty personnel, preceding infectious gastroenteritis and stress-related factors were identified as risk factors for new-onset IBS [5]. Anxiety and depression are frequent in IBS [6, 7], and the syndrome often coexists with other functional and psychiatric disorders [8].
The autonomic nervous system links central stress responses with gut function. Vagal pathways connect the brain with the gut and its microbiota [9], and cardiac vagal tone is regarded as an index of emotion regulation [10]. Studies of heart rate variability (HRV) in IBS indicate reduced parasympathetic activity that differs between IBS subtypes [11], and vagal tone has been related to negative affect in these patients [12].
Guidelines recommend combining dietary, pharmacological and psychological measures [13, 14]. However, phenotype-directed programmes for military personnel that include objective autonomic monitoring have rarely been described. This study aimed to compare psychometric and HRV profiles across IBS phenotypes in military personnel and to evaluate the changes that followed stepwise personalised therapy.
Materials and methods
Design and participants
The study was carried out at the Military Medical Academy of the Armed Forces of the Republic of Uzbekistan and the clinical sites of the Tashkent Pediatric Medical Institute within the 2023–2026 research programme of the Military Medical Hospital. It comprised a cross-sectional comparison of patients with IBS and controls and a prospective single-arm evaluation of personalised therapy. Reporting follows STROBE [15]. The study complied with the Declaration of Helsinki; all participants gave written informed consent.
A total of 207 military personnel aged 18–65 years referred to gastroenterology and internal medicine units were included. The main group comprised 187 patients with IBS diagnosed according to the Rome IV criteria [2]: IBS-C (n=62), IBS-D (n=54), IBS-M (n=43) and IBS-U (n=28). The control group comprised 20 apparently healthy military personnel without functional bowel disorders. Exclusion criteria were organic gastrointestinal disease (inflammatory bowel disease, tumours, coeliac disease or active peptic ulcer), severe decompensated cardiovascular, hepatic or renal disease, acute infection, psychiatric disorders precluding protocol completion and refusal to participate.
Clinical and psychometric assessment
A structured interview recorded age, military specialty, length of service, duty load including night shifts, sleep and meal patterns, chronic stressors, comorbidity, medication, the duration and triggers of IBS symptoms and the response to previous treatment. Food intolerance and gluten-related disorders were recorded during the clinical assessment. Anxiety and depression were assessed with the Hospital Anxiety and Depression Scale (HADS) [16] and the Beck Depression Inventory (BDI) [17], and pain intensity with a 0–10 visual analogue scale (VAS). Quality of life was measured with the IBS-QOL [18] and SF-36 [19] questionnaires, and gastrointestinal symptom-specific anxiety with the Visceral Sensitivity Index [20]. The personality profile was evaluated with the MMPI-2; the validity scales and ten basic clinical scales were expressed as T-scores [21].
Heart rate variability
HRV was recorded between 09:00 and 11:00 after 15 minutes of seated rest. Participants avoided intense exercise, caffeine, energy drinks and smoking for 12 hours beforehand. Five-minute electrocardiographic recordings were analysed for SDNN, RMSSD and pNN50 [22, 23], and the stress index (SI) of regulatory systems was calculated [24]. Recording conditions and indices were chosen in line with current recommendations [25].
Personalised therapy
Therapy lasted 8 weeks and followed a four-stage algorithm. Stage I was given to all patients and included education on the functional nature of IBS and the gut–brain axis, aimed at reducing symptom-focused anxiety and improving adherence. It also included a modified low-FODMAP diet adapted to national cuisine and the service routine, with 4–5 meals a day, adequate fluid intake and a lighter food load after night duty. Patients were advised to sleep at least 7 hours, limit energy drinks, caffeine and nicotine, and walk briskly for at least 30 minutes five times a week (at least 150 minutes of activity per week).
Stage II was phenotype-directed. Patients with IBS-C received psyllium (5–10 g/day), increased fluid intake, a morning defecation routine and, if required, osmotic laxatives and short courses of antispasmodics. Patients with IBS-D received loperamide on demand, antispasmodics and elimination of food triggers. In IBS-M, the regimen was adjusted to the predominant symptom and reviewed every 2 weeks. Antidepressants and other centrally acting agents were used when anxiety–depressive symptoms and visceral hypersensitivity were marked.
Stage III was intended for patients with reduced HRV, high anxiety sensitivity or a relapsing course. It included paced breathing (4-second inhalation and 6-second exhalation for 10 minutes twice daily), cognitive-behavioural elements, stress-management training, a symptom and trigger diary and sleep hygiene. Stage IV was used for marked bloating, unstable stool or post-infectious IBS and consisted of a multistrain probiotic containing Lactobacillus and Bifidobacterium, one capsule twice daily for 4–8 weeks. Outcomes were assessed after 8 weeks.
Statistical analysis
Analyses were performed with IBM SPSS Statistics 26.0 and R. Normality was checked with the Shapiro–Wilk test, and continuous data are presented as M±SD. Patients and controls were compared with Welch’s t-test, and the four phenotypes with Welch’s analysis of variance [26]. Categorical variables were compared with Fisher’s exact test, and odds ratios (ORs) are given with 95% confidence intervals (CIs). Associations were assessed with Pearson’s correlation coefficient, and changes after therapy with the paired t-test. Comparisons across the ten MMPI-2 scales were exploratory and were not adjusted for multiplicity. Differences were considered significant at p<0.05.
Results
Clinical characteristics
Patients and controls were of similar age (40.2±11.6 and 41.9±7.1 years; p=0.35), but body mass index was higher in the IBS group (24.3±6.4 vs 22.2±3.7 kg/m²; p=0.034). Abdominal pain and bloating were each reported by about two-thirds of patients, constipation by 59.9% and diarrhoea by 51.9% (Table 1). Depression was more frequent in patients than in controls (69.0% vs 45.0%; p=0.044), whereas the difference in anxiety disorders (62.0% vs 40.0%) was not significant (p=0.091). Food intolerance and upper gastrointestinal symptoms occurred with similar frequency in both groups.
| Characteristic | IBS n=187, n | IBS n=187, % | Control n=20, n | Control n=20, % | OR (95% CI) | p |
|---|---|---|---|---|---|---|
| Abdominal pain | 122 | 65.2 | 1 | 5.0 | 35.66 (4.67–272.43) | <0.001 |
| Bloating | 120 | 64.2 | 2 | 10.0 | 16.12 (3.63–71.61) | <0.001 |
| Constipation | 112 | 59.9 | 1 | 5.0 | 28.37 (3.72–216.48) | <0.001 |
| Diarrhoea | 97 | 51.9 | 0 | 0.0 | — | <0.001 |
| Depression | 129 | 69.0 | 9 | 45.0 | 2.72 (1.07–6.92) | 0.044 |
| Anxiety disorder | 116 | 62.0 | 8 | 40.0 | 2.45 (0.96–6.29) | 0.091 |
| Lactose intolerance | 47 | 25.1 | 3 | 15.0 | 1.90 (0.53–6.78) | 0.42 |
| Fructose intolerance | 32 | 17.1 | 2 | 10.0 | 1.86 (0.41–8.41) | 0.54 |
| Gluten-related disorders | 28 | 15.0 | 1 | 5.0 | 3.35 (0.43–26.01) | 0.32 |
| Nausea | 18 | 9.6 | 0 | 0.0 | — | 0.23 |
| Regurgitation | 18 | 9.6 | 1 | 5.0 | 2.02 (0.26–16.02) | 0.70 |
| Heartburn | 15 | 8.0 | 1 | 5.0 | 1.66 (0.21–13.25) | 1.00 |
OR, odds ratio (not estimable when the control group had no cases); p, two-sided Fisher’s exact test.
Psychometric profile
The highest mean T-score in patients with IBS was found on the hypochondriasis scale (72.0±12.0 vs 63.6±17.9 in controls; p=0.053), followed by the depression and hysteria scales (Table 2). With a control group of 20 and wide variation in its scores, none of the differences between the IBS group as a whole and controls reached significance. The MMPI-2 validity scales were within the acceptable range in both groups.
| Scale | Control n=20 | IBS n=187 | Difference (95% CI) | p | p across phenotypes* |
|---|---|---|---|---|---|
| Hypochondriasis (Hs) | 63.6±17.9 | 72.0±12.0 | 8.4 (−0.1 to 16.9) | 0.053 | 0.30 |
| Depression (D) | 60.0±16.0 | 65.0±11.5 | 5.0 (−2.6 to 12.6) | 0.19 | 0.22 |
| Hysteria (Hy) | 57.6±14.4 | 63.3±10.9 | 5.7 (−1.2 to 12.6) | 0.10 | 0.005 |
| Psychopathic deviate (Pd) | 52.5±14.1 | 54.0±9.1 | 1.5 (−5.2 to 8.2) | 0.65 | 0.20 |
| Masculinity–femininity (Mf) | 52.1±12.8 | 54.2±8.1 | 2.1 (−4.0 to 8.2) | 0.48 | 0.84 |
| Paranoia (Pa) | 53.1±13.4 | 58.1±9.4 | 5.0 (−1.4 to 11.4) | 0.12 | 0.13 |
| Psychasthenia (Pt) | 54.8±14.1 | 58.3±9.1 | 3.5 (−3.2 to 10.2) | 0.29 | 0.072 |
| Schizophrenia (Sc) | 55.0±14.1 | 55.9±10.4 | 0.9 (−5.8 to 7.6) | 0.78 | <0.001 |
| Hypomania (Ma) | 50.9±13.4 | 54.6±10.4 | 3.7 (−2.7 to 10.1) | 0.24 | <0.001 |
| Social introversion (Si) | 54.4±13.9 | 55.6±9.3 | 1.2 (−5.4 to 7.8) | 0.71 | 0.26 |
Data are M±SD; differences and p-values from Welch’s t-test. *Welch’s ANOVA comparing IBS-C, IBS-D, IBS-M and IBS-U.
The profiles differed considerably between phenotypes (Figure 1). Significant differences were found for the hysteria (p=0.005), schizophrenia (p<0.001) and hypomania (p<0.001) scales. IBS-M showed the most deviant profile, with the highest hypochondriasis (75.6±16.6), depression (69.2±16.3), hysteria (69.6±13.7), psychasthenia (62.1±12.1) and schizophrenia (63.0±13.6) T-scores. Compared with controls, IBS-M differed on the Hs (p=0.016), D (p=0.041), Hy (p=0.004), Sc (p=0.041) and Ma (p=0.018) scales. In IBS-C, the hypomania score was elevated (59.0±11.7; p=0.022 vs controls), whereas IBS-D and IBS-U had the lowest schizophrenia and hypomania scores, and the IBS-U profile was close to that of controls.
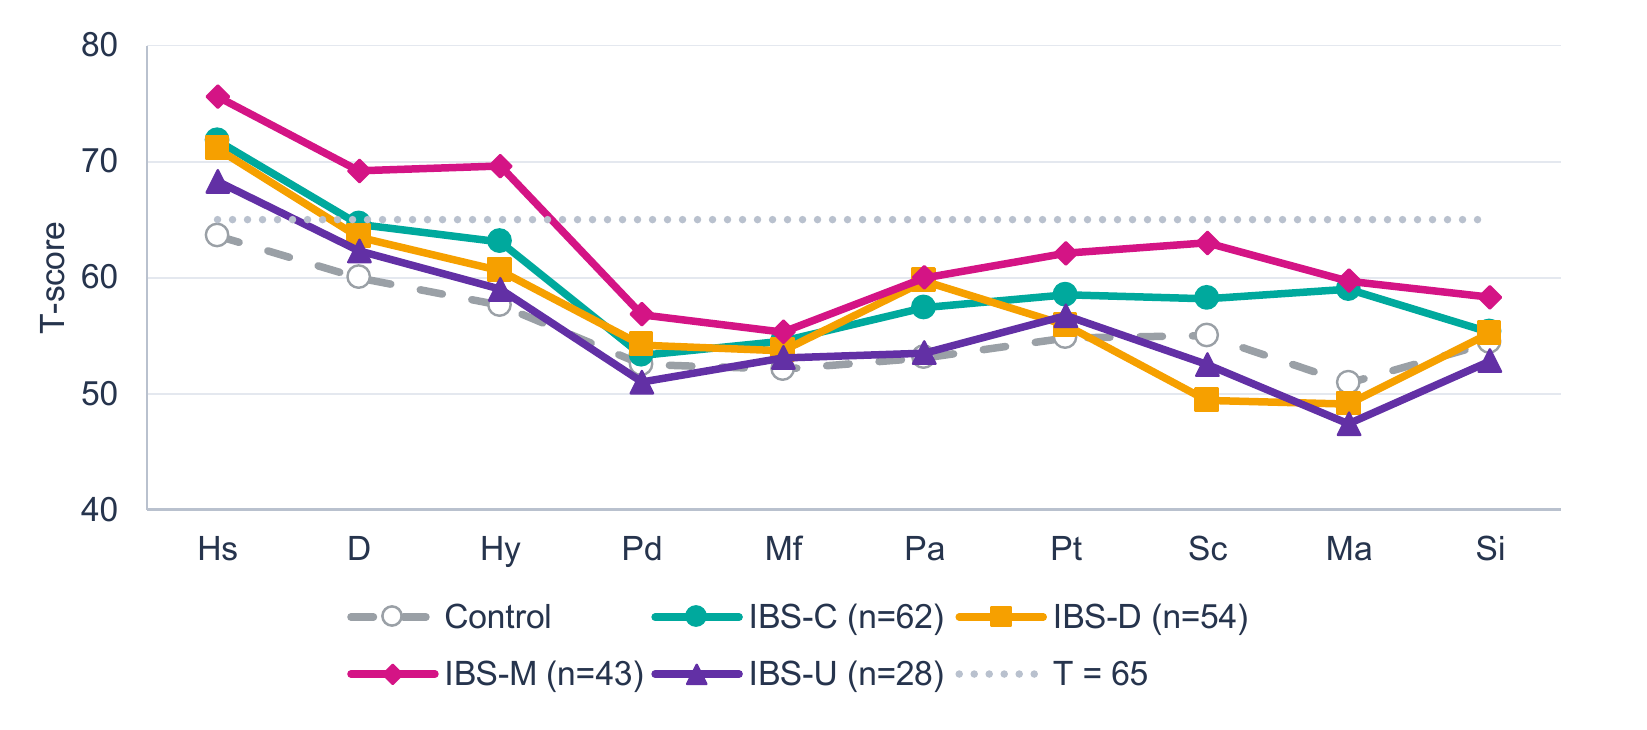
Mean T-scores. Phenotypes differed on Hy (p=0.005), Sc (p<0.001) and Ma (p<0.001); the dotted line marks T=65.
Autonomic regulation
Before treatment, mean SDNN in patients with IBS was 34.8 ms, RMSSD 25.7 ms, pNN50 8.2% and SI 279.9±49.1. Vagally mediated indices were lowest in IBS-D (Table 3): RMSSD was 23.4±5.7 ms compared with 27.1±6.3 ms in IBS-C (p=0.001), and pNN50 was 7.4±1.7% compared with 8.7±2.1% (p<0.001). Differences between the four phenotypes were significant for RMSSD (p=0.009) and pNN50 (p=0.003), while the difference for SDNN was of borderline significance (p=0.050).
| Index | Assessment | IBS-C n=62 | IBS-D n=54 | IBS-M n=43 | IBS-U n=28 | p* |
|---|---|---|---|---|---|---|
| SDNN | Baseline | 36.3±8.2 | 32.6±6.8 | 35.8±8.7 | 33.9±9.6 | 0.050 |
| SDNN | 8 weeks | 45.3±9.9 | 41.6±8.5 | 44.2±10.6 | 42.1±12.1 | 0.17 |
| RMSSD | Baseline | 27.1±6.3 | 23.4±5.7 | 25.7±7.1 | 27.3±8.6 | 0.009 |
| RMSSD | 8 weeks | 36.0±8.3 | 32.1±7.5 | 34.8±9.2 | 35.4±11.3 | 0.065 |
Data are M±SD. *Welch’s ANOVA across phenotypes. Within each phenotype, both indices increased after therapy (p<0.01).
Lower vagal activity was associated with worse psychological status and more intense pain (Figure 2). RMSSD and pNN50 correlated inversely with HADS anxiety (r=−0.59 for both), HADS depression (r=−0.47 and −0.45) and pain intensity (r=−0.55 and −0.57), and directly with SF-36 general health (r=0.45 and 0.46). SDNN showed weaker associations, and no significant correlation was found with stool frequency.
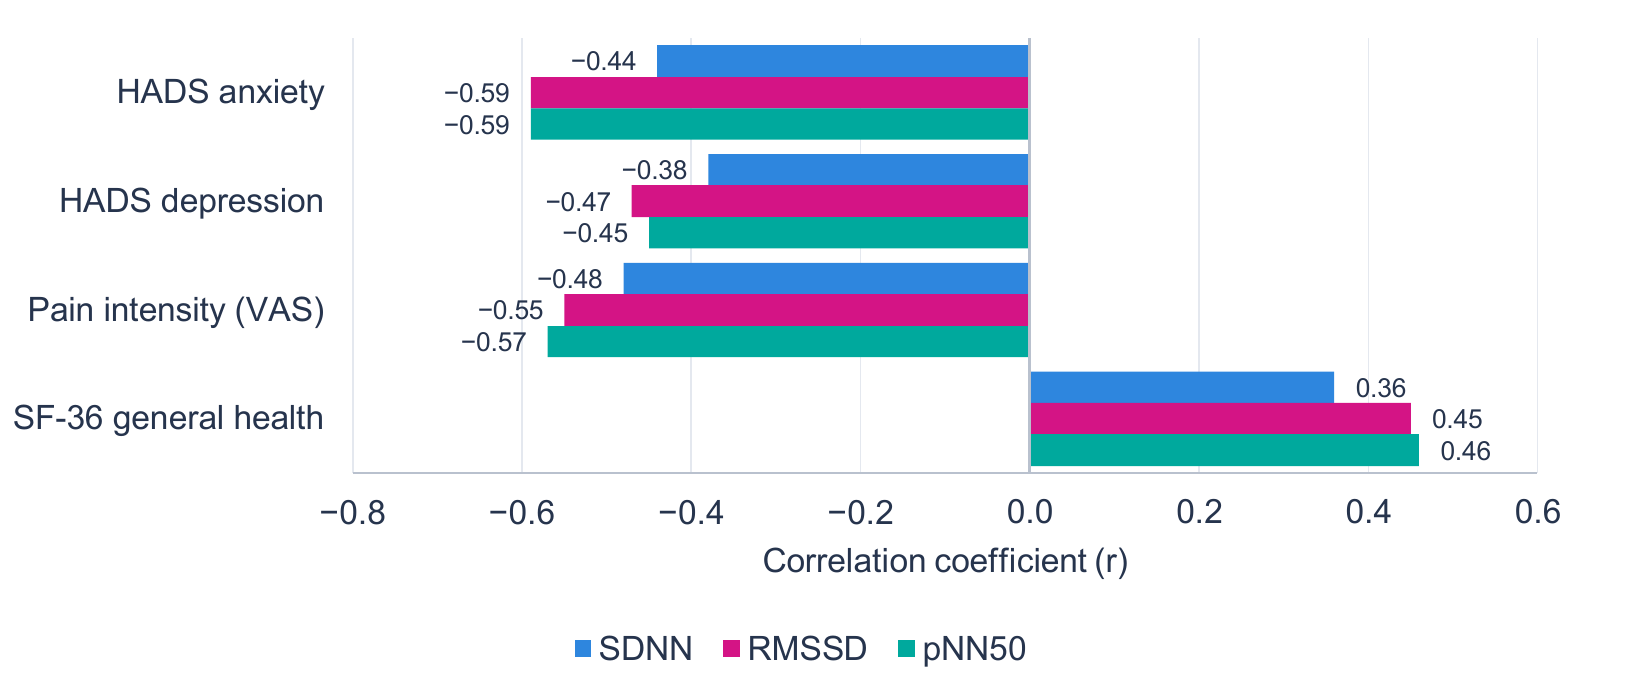
Pearson’s r in 187 patients with IBS; all coefficients shown are significant at p<0.001.
Response to personalised therapy
After 8 weeks, SDNN increased from 34.8 to 43.5 ms (+25%), RMSSD from 25.7 to 34.5 ms (+34%) and pNN50 from 8.2% to 13.6%, while SI decreased from 279.9±49.1 to 178.0±31.0 (−36%); all changes were significant (p<0.001). The gains were observed in every phenotype (Table 3, Figure 3). The largest relative increases in RMSSD (+37.2%) and pNN50 (+74.3%) occurred in IBS-D, and after therapy the between-phenotype differences were no longer significant (RMSSD p=0.065; pNN50 p=0.43).
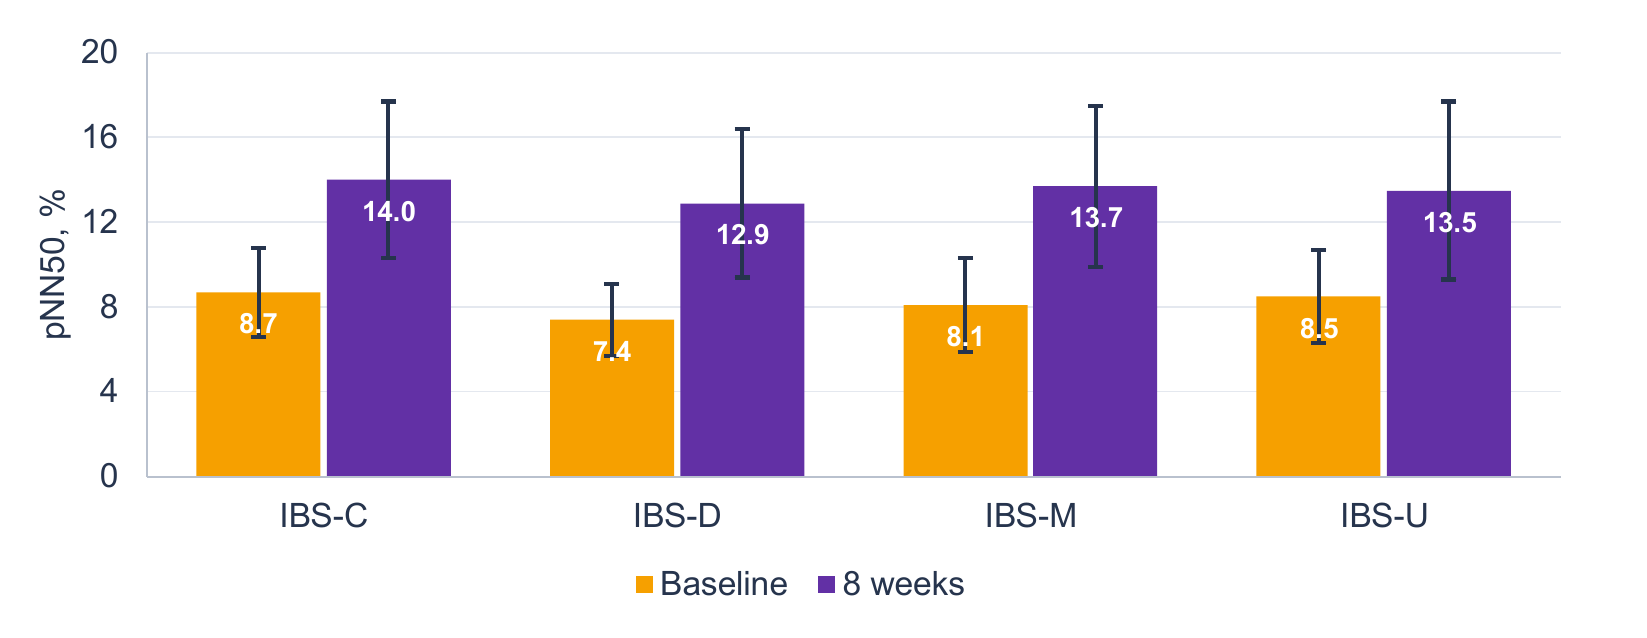
Bars show means and error bars show SD. Baseline differences between phenotypes p=0.003; after therapy p=0.43.
Psychological status and quality of life improved in parallel (Table 4). The HADS anxiety score decreased by 3.6 points and the depression score by 4.0 points, and the BDI score decreased by 6.9 points. The IBS-QOL score increased by 17.7 points, and the SF-36 mental health score by 16.3 points.
| Scale | Baseline | 8 weeks | Change | p |
|---|---|---|---|---|
| HADS anxiety | 10.3±1.8 | 6.7±1.2 | −3.6 (−35.0%) | <0.001 |
| HADS depression | 9.7±1.6 | 5.7±1.2 | −4.0 (−41.2%) | <0.001 |
| BDI | 17.4±3.0 | 10.5±1.9 | −6.9 (−39.7%) | <0.001 |
| IBS-QOL | 57.2±9.6 | 74.9±12.3 | +17.7 (+30.9%) | <0.001 |
| SF-36 physical functioning | 58.5±9.8 | 72.0±11.8 | +13.5 (+23.1%) | <0.001 |
| SF-36 mental health | 54.8±8.7 | 71.1±11.2 | +16.3 (+29.7%) | <0.001 |
Data are M±SD; p, paired t-test. Lower HADS and BDI scores and higher IBS-QOL and SF-36 scores indicate improvement.
Discussion
In this cohort of military personnel, IBS phenotypes differed in both psychological profile and autonomic regulation. The mixed phenotype had the most deviant MMPI-2 profile, whereas the diarrhoea-predominant phenotype had the lowest vagally mediated HRV. After an 8-week personalised programme, HRV indices, anxiety, depression and quality of life improved in all phenotypes, and baseline autonomic differences between them were no longer detectable.
Depression was identified in more than two-thirds of patients, which is in keeping with the high prevalence of anxiety and depression reported in meta-analyses of IBS [6, 7]. The rates in controls were also considerable, which may reflect the occupational stress shared by all participants. The small control group limited the power to detect differences in anxiety and in MMPI-2 scores between the IBS group as a whole and controls. Hypochondriasis nevertheless showed the highest elevation in patients, consistent with the somatic focus and comorbidity described in IBS [8]. Mean scores above T=65, commonly regarded as clinically elevated on the MMPI-2 [21], were found for hypochondriasis in all IBS phenotypes and for depression and hysteria in IBS-M.
The autonomic findings agree with previous HRV studies. A literature review found that HRV findings in IBS differ between IBS subtypes [11]. In the present cohort, low RMSSD and pNN50 were most characteristic of IBS-D. Vagal tone has been linked with negative affect and stress hormones in IBS [12], and the neurovisceral integration model regards cardiac vagal control as a marker of emotion regulation capacity [10]. The correlations of RMSSD and pNN50 with anxiety and pain support this interpretation. Baseline SDNN and RMSSD values were also lower than the short-term reference values summarised in the literature [23].
The therapeutic programme combined measures with established efficacy in IBS: a low-FODMAP approach [27], centrally acting agents and psychological therapies [28] and phenotype-directed symptomatic treatment recommended by current guidelines [13, 14]. Slow paced breathing resembles HRV biofeedback, which has shown the largest effects on anxiety and depression in a meta-analysis [29]. HRV has also been proposed as an objective marker of the efficacy of complementary therapies in IBS [30]. In our cohort, the mean HADS anxiety score fell from the borderline range to below 8 points, the threshold proposed by the authors of the scale [16].
For military medicine, HRV and psychometric assessment are practical because they are non-invasive and can be repeated during service. Patients with IBS-D and reduced RMSSD and patients with IBS-M and a markedly elevated MMPI-2 profile may benefit most from early inclusion of the autonomic and psychological components of therapy.
Limitations
The control group was small, which reduced the power of comparisons with patients. The therapeutic evaluation had no untreated or placebo arm, so regression to the mean, placebo response and natural fluctuation of symptoms cannot be excluded. Because therapy was multicomponent, the contribution of individual components cannot be determined. HRV was recorded as a single short-term measurement at each time point, and follow-up was limited to 8 weeks. The MMPI-2 comparisons were exploratory.
Conclusion
In military personnel, IBS phenotypes differed in psychological profile and vagal regulation: IBS-M showed the most deviant MMPI-2 profile and IBS-D the lowest RMSSD and pNN50. Vagally mediated HRV indices were inversely related to anxiety, depression and pain. Stepwise personalised therapy was followed by higher SDNN, RMSSD and pNN50, a lower stress index, less anxiety and depression and better quality of life. HRV and psychometric assessment can support the stratification and monitoring of IBS in military personnel, and a controlled trial is needed to confirm the effect of the programme.