
Full text
Corresponding author: Nasimov E.E., Tashkent State Dental Institute, Tashkent, Uzbekistan.
Introduction
The relationship between malocclusion and temporomandibular disorders (TMD) has been debated for decades. Systematic reviews conclude that no single occlusal feature predicts TMD and that occlusion cannot be regarded as its primary cause [1, 2]; nevertheless, epidemiological cohorts consistently report that certain occlusal configurations — posterior crossbite with functional shift, deep bite with retroclined incisors, Class II and anterior open bite — are more often accompanied by signs of dysfunction in adolescents [3–5]. Tomographic studies have described a tendency toward a more posterior condylar position in Class II patients and a more anterior position in Class III, with differences in condyle and fossa shape between skeletal patterns [6–8]. Combined anomalies, in which sagittal, vertical and transverse discrepancies coexist, expose the joint to superimposed forced positions and are precisely the cases in which the joint component is most easily overlooked at the diagnostic stage [9].
A particular clinical problem is latent dysfunction: abnormal joint sounds and altered condylar dynamics without pain or complaints. Magnetic resonance imaging has shown internal derangements in about a third of asymptomatic volunteers [10, 11], and joint vibration analysis and phonoarthrography detect acoustic abnormalities that escape history taking and palpation, although the reliability of acoustic methods is only moderate [12, 13]. Condylar position can be quantified on CBCT by the anterior, superior and posterior joint spaces [14, 15]; the linear ratio proposed by Pullinger and Hollender separates concentric, anterior and posterior condylar positions [16]. Data combining a functional acoustic classification with CBCT joint-space measurements across skeletal classes in a single orthodontic cohort are scarce, and the specific profile of latent dysfunction has not been characterised.
The aim of this study was to determine the prevalence and structure of clinically manifest and latent TMJ dysfunction in patients with combined dentofacial anomalies and to relate the functional status to condylar position measured on CBCT in skeletal Classes I, II/1, II/2 and III.
Materials and methods
The cross-sectional analysis is part of a prospective study (2019–2023, Tashkent and Samarkand) of 234 patients aged 8–29 years with combined anomalies of occlusion in the sagittal, vertical and transverse planes, allocated by skeletal class into four groups, and 30 controls — dental students with physiological occlusion, facial symmetry and centric condylar position on CBCT. Growth potential was considered retained up to and including 15 years of age and completed from 16 years [17]. Written informed consent was obtained from all participants or their legal representatives.
Every subject underwent bilateral palpation of the masticatory muscles and TMJ region with the mouth closed, half-open and maximally open to identify trigger zones, tenderness, clicking and deviation, followed by digital auscultation of both joints with a 3M Littmann electronic stethoscope; the sound signal was recorded in real time as a phonoarthrogram and stored for longitudinal comparison. Three acoustic patterns were distinguished: (i) a clean isoline with a single peak on the working side; (ii) chaotic multi-amplitude peaks with irregular timing, typical of premature or delayed occlusal contacts; (iii) small repeated low-amplitude peaks with right–left asymmetry and periods of clean isoline. TMJ status was graded as: no dysfunction — no pain, no trigger zones, pattern (i); clinically manifest dysfunction — pain or trigger zones on palpation combined with pattern (ii); latent dysfunction — no complaints, no pain on palpation, pattern (iii). The grading was performed by one examiner blinded to the CBCT data.
On CBCT (sagittal slice through the centre of the condyle, corrected to the Frankfort horizontal) the anterior (A), superior (S) and posterior (P) joint spaces were measured in millimetres as the shortest distances between the condylar surface and the fossa [14]. The condylar position ratio was calculated as (P−A)/(P+A)×100: values between −12 and +12 % were interpreted as concentric, above +12 % as anterior and below −12 % as posterior condylar position [16]. Transverse skeletal relationship was assessed by the Yonsei Transverse Index (YTI) at the first-molar furcation level [18]. Data are given as M±SD or n (%) with 95 % Wilson confidence intervals (CI). Groups were compared with Pearson’s χ² test (effect size — Cramér’s V), Fisher’s exact test and Welch’s t-test versus controls; p<0.05 was considered significant (Statistica 13.0, RStudio).
Results
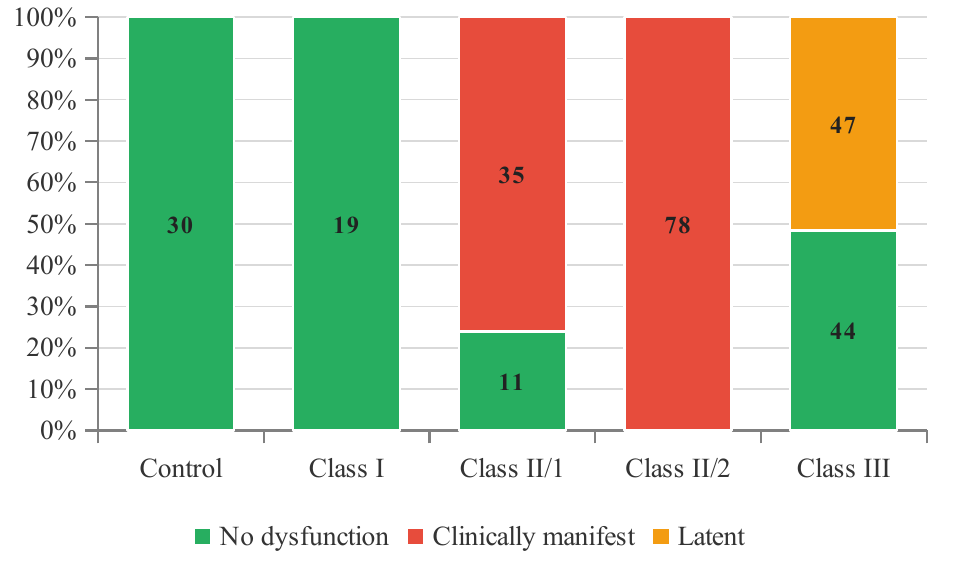
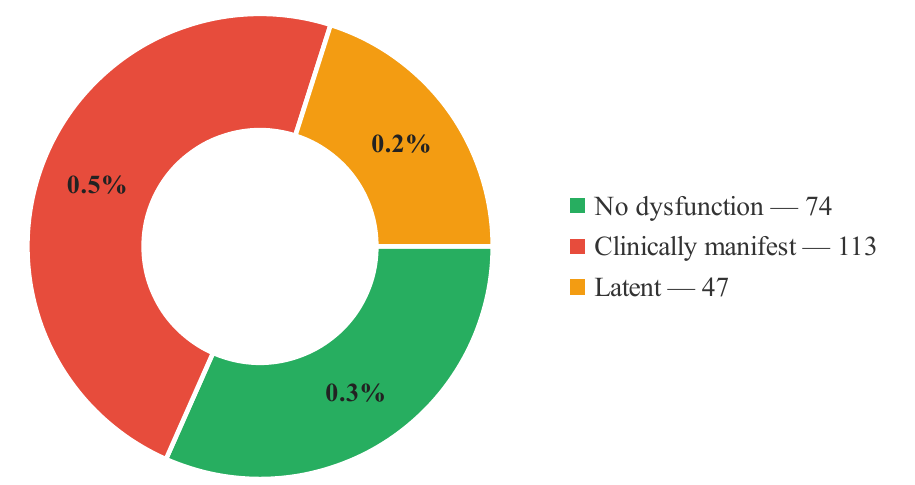
Signs of TMJ dysfunction were found in 160 of 234 patients (68.4 %; 95 % CI 62.2–74.0) and in none of the controls (Table 1, Figs. 1 and 2). Clinically manifest dysfunction — pain or trigger zones with a chaotic acoustic pattern — was diagnosed in 113 patients (48.3 %; 95 % CI 42.0–54.7); latent dysfunction, revealed only by phonoarthrography, in 47 (20.1 %; 95 % CI 15.5–25.7). The distribution of functional status differed markedly between skeletal classes (χ²=239.2; df=6; p<0.001; Cramér’s V=0.71). All 78 patients with Class II/2 and 35 of 46 (76.1 %) with Class II/1 had manifest dysfunction; in Class II/2 the pain was sharp and load-dependent, with sounds in the initial phase of mouth opening when the blocking anterior contact is overcome, whereas in Class II/1 sounds appeared mainly at the end of opening. Latent dysfunction was confined to Class III, where it affected 47 of 91 patients (51.6 %); Class I patients and controls showed neither pain nor acoustic abnormalities.
| Group | n | Age, years (M±SD) | TMJ functional status, n (%) | TMJ functional status, n (%) | TMJ functional status, n (%) | Pain / trigger zones, n (%) | Phonoarthrogram pattern, n | Phonoarthrogram pattern, n | Phonoarthrogram pattern, n |
|---|---|---|---|---|---|---|---|---|---|
| Group | n | Age, years (M±SD) | no dysfunction | manifest | latent | Pain / trigger zones, n (%) | clean, single peak | chaotic peaks | small repeated / asymmetric |
| Control (physiological occlusion) | 30 | 22.9±3.5 | 30 (100.0) | 0 (0.0) | 0 (0.0) | 0 (0.0) | 30 | 0 | 0 |
| Group 1 (skeletal Class I) | 19 | 17.3±6.1 | 19 (100.0) | 0 (0.0) | 0 (0.0) | 0 (0.0) | 19 | 0 | 0 |
| Group 2 (skeletal Class II/1) | 46 | 18.3±6.4 | 11 (23.9) | 35 (76.1) | 0 (0.0) | 35 (76.1) | 11 | 35 | 0 |
| Group 3 (skeletal Class II/2) | 78 | 18.7±6.3 | 0 (0.0) | 78 (100.0) | 0 (0.0) | 78 (100.0) | 0 | 78 | 0 |
| Group 4 (skeletal Class III) | 91 | 16.8±6.3 | 44 (48.4) | 0 (0.0) | 47 (51.6) | 0 (0.0) | 44 | 0 | 47 |
| Clinical sample (Groups 1–4) | 234 | 17.9±6.3 | 74 (31.6) | 113 (48.3) | 47 (20.1) | 113 (48.3) | 74 | 113 | 47 |
Note. Percentages are calculated within each group. Manifest dysfunction = pain or trigger zones with a chaotic phonoarthrogram; latent dysfunction = no complaints or pain, small repeated peaks or right–left asymmetry. Between-group difference in functional status: χ²=239.2, df=6, p<0.001, Cramér’s V=0.71.
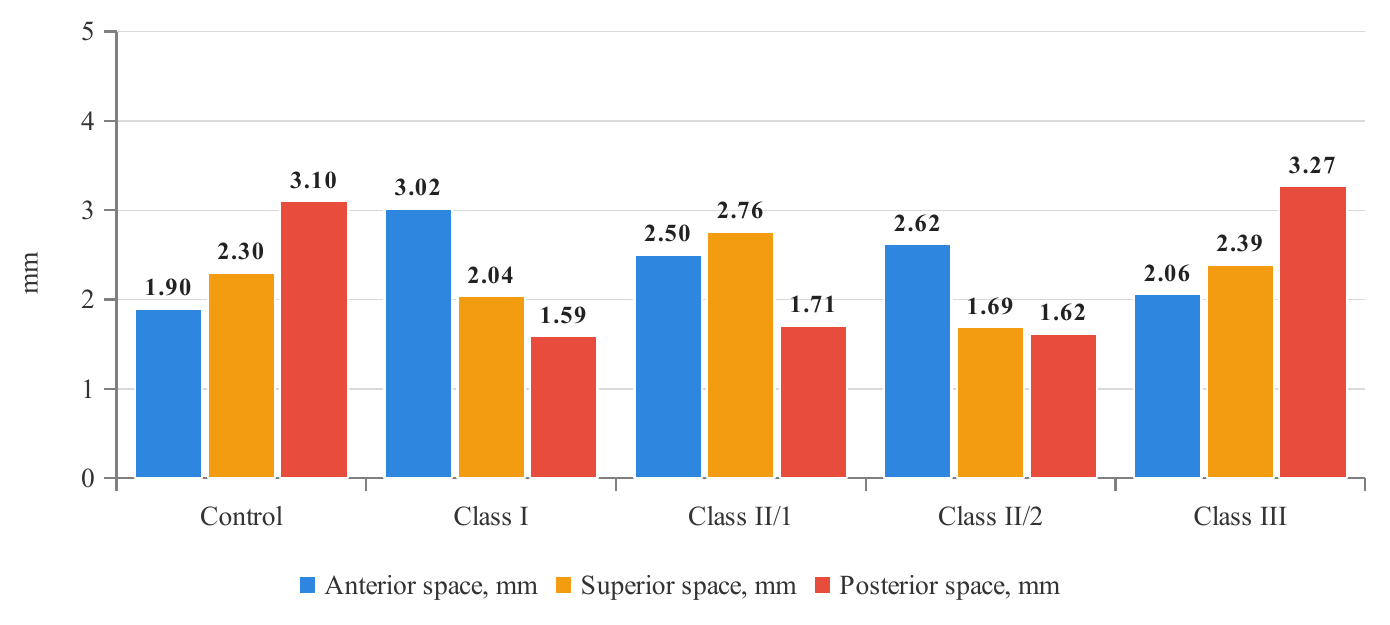
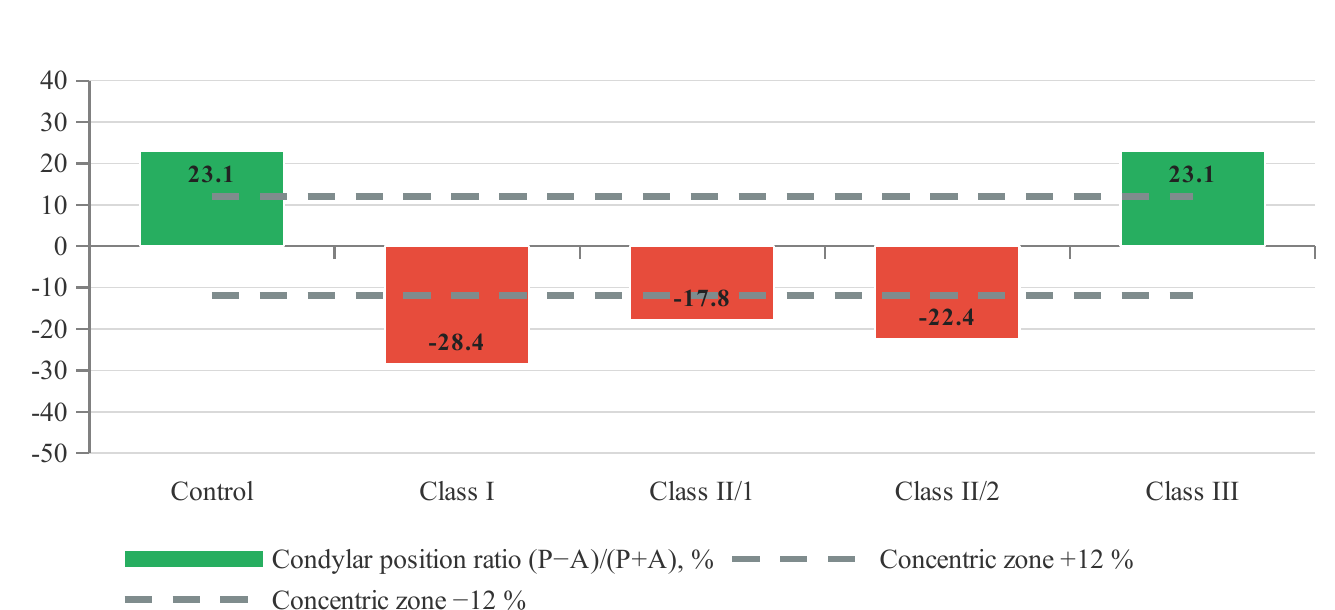
CBCT measurements (Table 2, Fig. 3) revealed two opposite patterns of condylar position. In controls the posterior joint space (3.10±0.66 mm) exceeded the anterior (1.90±0.21 mm), giving a positive condylar position ratio of 23.1±10.6 %. In Classes I, II/1 and II/2 the posterior space was narrowed to 1.59±0.25, 1.71±0.29 and 1.62±0.15 mm (p<0.001 versus controls), the anterior space was widened, and the ratio became negative (−28.4, −17.8 and −22.4 %; p<0.001), i.e. the condyle was displaced posteriorly. A posterior position (ratio below −12 %) was recorded in 15 of 19 Class I (78.9 %), 29 of 46 Class II/1 (63.0 %) and 72 of 78 Class II/2 patients (92.3 %). The superior space was reduced only in Class II/2 (1.69±0.25 mm; p<0.001), reflecting cranio-posterior compression of the condyle by the deep anterior block. Class III joints did not differ from controls in any space (ratio 23.1±7.6 %; p=0.99): the condyle retained an anterior-concentric position despite the highest prevalence of latent dysfunction.
| Parameter | Control (n=30) | Class I (n=19) | p₁ | Class II/1 (n=46) | p₂ | Class II/2 (n=78) | p₃ | Class III (n=91) | p₄ |
|---|---|---|---|---|---|---|---|---|---|
| Anterior joint space, mm | 1.90±0.21 | 3.02±0.98 | <0.001 | 2.50±0.61 | <0.001 | 2.62±0.68 | <0.001 | 2.06±0.34 | <0.01 |
| Superior joint space, mm | 2.30±0.28 | 2.04±2.05 | 0.59 | 2.76±0.78 | <0.001 | 1.69±0.25 | <0.001 | 2.39±0.51 | 0.23 |
| Posterior joint space, mm | 3.10±0.66 | 1.59±0.25 | <0.001 | 1.71±0.29 | <0.001 | 1.62±0.15 | <0.001 | 3.27±0.14 | 0.17 |
| Condylar position ratio (P−A)/(P+A), % | 23.1±10.6 | −28.4±17.0 | <0.001 | −17.8±12.7 | <0.001 | −22.4±9.3 | <0.001 | 23.1±7.6 | 1.00 |
| Posterior condylar position (ratio < −12 %), n (%) | 0 (0.0) | 15 (78.9) | <0.001 | 29 (63.0) | <0.001 | 72 (92.3) | <0.001 | 0 (0.0) | — |
| Anterior condylar position (ratio > +12 %), n (%) | 27 (90.0) | 0 (0.0) | <0.001 | 0 (0.0) | <0.001 | 0 (0.0) | <0.001 | 84 (92.3) | 0.87 |
Note. p₁–p₄ — Welch’s t-test versus controls for continuous variables and Fisher’s exact test for proportions. Red shading — significant narrowing of the posterior/superior space or negative ratio (condylar retroposition); yellow — other significant differences.
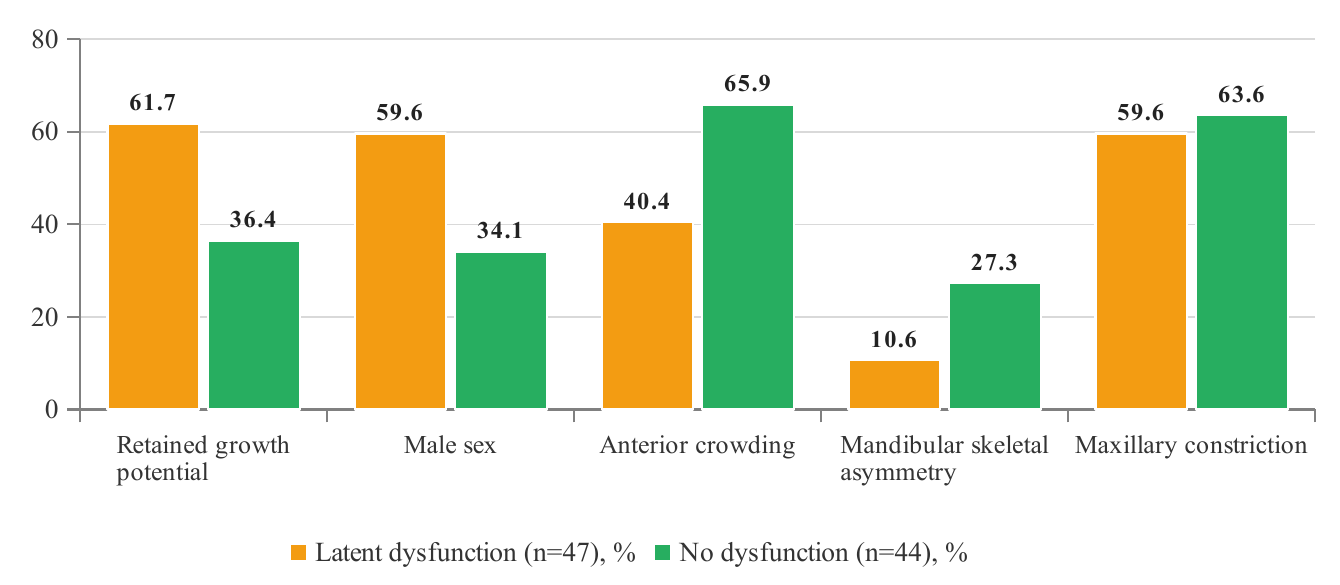
Because latent dysfunction occurred exclusively in Class III, the 47 affected patients were compared with the 44 Class III patients without functional signs (Table 3). The two subgroups did not differ in YTI, maxillary constriction or joint spaces, but latent dysfunction was more frequent in patients with retained growth potential (29 of 47, 61.7 %, versus 16 of 44, 36.4 %; p=0.021) and in males (59.6 versus 34.1 %; p=0.021), whereas anterior crowding (40.4 versus 65.9 %; p=0.021) and, as a trend, mandibular skeletal asymmetry (10.6 versus 27.3 %; p=0.059) were less frequent. Thus the acoustic abnormalities of Class III were not a consequence of a displaced condyle but of an unstable, forced transverse and sagittal positioning of a growing mandible on a narrow maxilla.
| Characteristic | Latent dysfunction (n=47) | No dysfunction (n=44) | p | Interpretation |
|---|---|---|---|---|
| Age, years (M±SD) | 15.7±6.0 | 17.9±6.6 | 0.10 | Younger, not significant |
| Retained growth potential (8–15 years), n (%) | 29 (61.7) | 16 (36.4) | 0.021 | Growth-related instability |
| Male sex, n (%) | 28 (59.6) | 15 (34.1) | 0.021 | Higher masticatory load |
| Anterior crowding, n (%) | 19 (40.4) | 29 (65.9) | 0.021 | Less dentoalveolar compensation |
| Maxillary constriction, n (%) | 28 (59.6) | 28 (63.6) | 0.83 | Equal transverse deficit |
| YTI, mm (M±SD) | −5.46±3.37 | −5.79±3.75 | 0.67 | Equal skeletal deficit |
| Mandibular skeletal asymmetry, n (%) | 5 (10.6) | 12 (27.3) | 0.059 | Functional, not structural shift |
| Anterior joint space, mm | 1.99±0.31 | 2.14±0.36 | <0.05 | Concentric condyle in both |
| Superior joint space, mm | 2.42±0.57 | 2.36±0.44 | 0.54 | — |
| Posterior joint space, mm | 3.29±0.15 | 3.24±0.12 | 0.08 | — |
Note. p — Welch’s t-test for continuous variables, Fisher’s exact test for proportions.
Longitudinal observation during comprehensive orthodontic treatment (transverse correction first, then control of the occlusal plane and sagittal positioning of the mandible into a constructive bite with single occlusal “disengagers” instead of block splints) showed that positional disorders — functional displacement of the condyle in the fossa, transverse shift and asymmetric loading — normalised together with the occlusal relationship, and pain and sounds decreased. Morphological changes already present on CBCT (resorption of the articular eminence slope and of the functional condylar surface) showed only weak positive dynamics of structure, although condylar positioning improved (Table 4). Phonoarthrograms stored at each stage documented the transition from chaotic to single-peak patterns.
| Component | Before treatment | After occlusal normalisation | Direction of change | Clinical implication |
|---|---|---|---|---|
| Condylar position in the fossa | Retroposition (Classes I–II), forced transverse shift (Class III) | Centric / concentric positioning | Positive, positional | Constructive bite, transverse correction first |
| Pain and joint sounds | Present in manifest dysfunction (113) | Decreased with improved positioning | Positive | Serial phonoarthrography at each stage |
| Latent acoustic abnormalities | Small repeated peaks, asymmetry (47) | Single clean peak after stabilisation | Positive, reversible | Detectable only by auscultation |
| Morphological changes (eminence slope, condylar surface) | Present in long-standing occlusal overload | Weak structural dynamics, better positioning | Weakly positive | Prevention before irreversible remodelling |
Discussion
The principal finding is that a joint component is present in two thirds of patients seeking treatment for combined dentofacial anomalies and that in every fifth patient it is silent. The 68.4 % prevalence of signs is higher than the population estimates for adolescents [3, 5], which is expected in a referral sample enriched with severe, multi-plane discrepancies; the proportion of latent dysfunction (20.1 %) is in the range of asymptomatic internal derangements reported on MRI in volunteers [10, 11]. The strength of association between skeletal class and functional status (Cramér’s V=0.71) contrasts with the weak associations found in unselected populations [1, 2] and indicates that in combined anomalies the occlusal configuration is not a random covariate but a structural determinant of joint loading.
Two different mechanisms of dysfunction emerge from the CBCT data. In Class II — and most sharply in Class II/2 — the condyle is displaced posteriorly and, in II/2, cranially: the posterior joint space shrinks to about half of the control value and the superior space narrows. This is the pattern expected when retroclined upper incisors block the mandible distally and the deep overbite prevents forward sliding, and it agrees with tomographic descriptions of a more posterior condyle in Class II patients and of distinct condyle–fossa morphology between skeletal patterns [6–8]. The 100 % rate of manifest dysfunction in Class II/2 is therefore a mechanical consequence rather than a coincidence. In Class III, by contrast, the condyle is anterior-concentric and indistinguishable from controls, yet half of the patients produce abnormal small repeated vibrations. The comparison within Class III shows that this latent pattern clusters in growing males with little dental crowding and is not related to the degree of transverse deficit or to structural mandibular asymmetry; we interpret it as the acoustic signature of a functional, muscle-guided lateral or protrusive positioning of the mandible on a narrow maxilla — the same mechanism that produces condylar asymmetry in unilateral crossbite. Since the joint is concentric and the changes are positional, this is the group in which early transverse correction is most likely to prevent progression.
The Class I group is instructive: its condyles were the most posteriorly displaced of all groups (ratio −28.4 %) while no patient had pain or acoustic abnormality. A displaced but silent condyle suggests that, in the absence of a sagittal skeletal discrepancy, the periodontal–muscular system compensates the position for a long time; however, compensation is not innocuous, because remodelling of the eminence slope and condylar surface was observed on CBCT in this very group. Positional CBCT findings therefore cannot be interpreted without functional data, and functional data cannot replace imaging — the two methods answer different questions. This supports the diagnostic sequence adopted in our protocol: palpation and auscultation for all patients, CBCT joint-space measurement for those with abnormal patterns or high-risk occlusal configurations, and MRI only when soft-tissue derangement must be confirmed [9, 19].
The treatment-phase observations agree with the literature: functional (positional) disorders respond to occlusal normalisation, whereas established morphological changes do not regress [2, 19, 20]. This asymmetry is the strongest argument for detecting latent dysfunction before it becomes morphological. Limitations of the study include its cross-sectional design and allocation by skeletal class rather than random sampling; the single-examiner acoustic grading, whose reproducibility is known to be moderate [13]; the absence of MRI verification and of Axis II DC/TMD assessment [21]; and the fact that the control group was selected for an anterior-concentric condylar position, so that part of the between-group difference in the ratio reflects this inclusion criterion. Longitudinal follow-up of the latent subgroup is needed to establish its conversion rate to manifest dysfunction.
Conclusions
1. TMJ dysfunction accompanies combined dentofacial anomalies in 68.4 % of patients aged 8–29 years: clinically manifest in 48.3 % and latent — detectable only by digital auscultation — in 20.1 %.
2. Functional status is strongly determined by skeletal class (Cramér’s V=0.71): manifest dysfunction affects all Class II/2 and three quarters of Class II/1 patients, latent dysfunction is confined to Class III (51.6 %), and Class I patients are symptom-free.
3. Classes I, II/1 and II/2 show condylar retroposition (posterior joint space 1.59–1.71 mm versus 3.10 mm in controls; ratio −17.8 to −28.4 %; p<0.001), whereas Class III joints are concentric; latent dysfunction in Class III is associated with retained growth potential and male sex, not with condylar displacement.
4. Palpation, digital phonoarthrography and CBCT joint-space analysis are complementary and should be included in the routine protocol; positional disorders are reversible with comprehensive occlusal correction, morphological changes are not.
Conflict of interest. The authors declare no conflict of interest.
Funding. The study was carried out within the research plan of Samarkand State Medical University (state registration number 011400196) without external funding.
Ethics. The protocol was approved by the institutional ethics committee; informed consent was obtained from all participants.
Author contributions. J.A.R. — study concept and supervision; E.E.N. — clinical examination, phonoarthrography, analysis, manuscript.